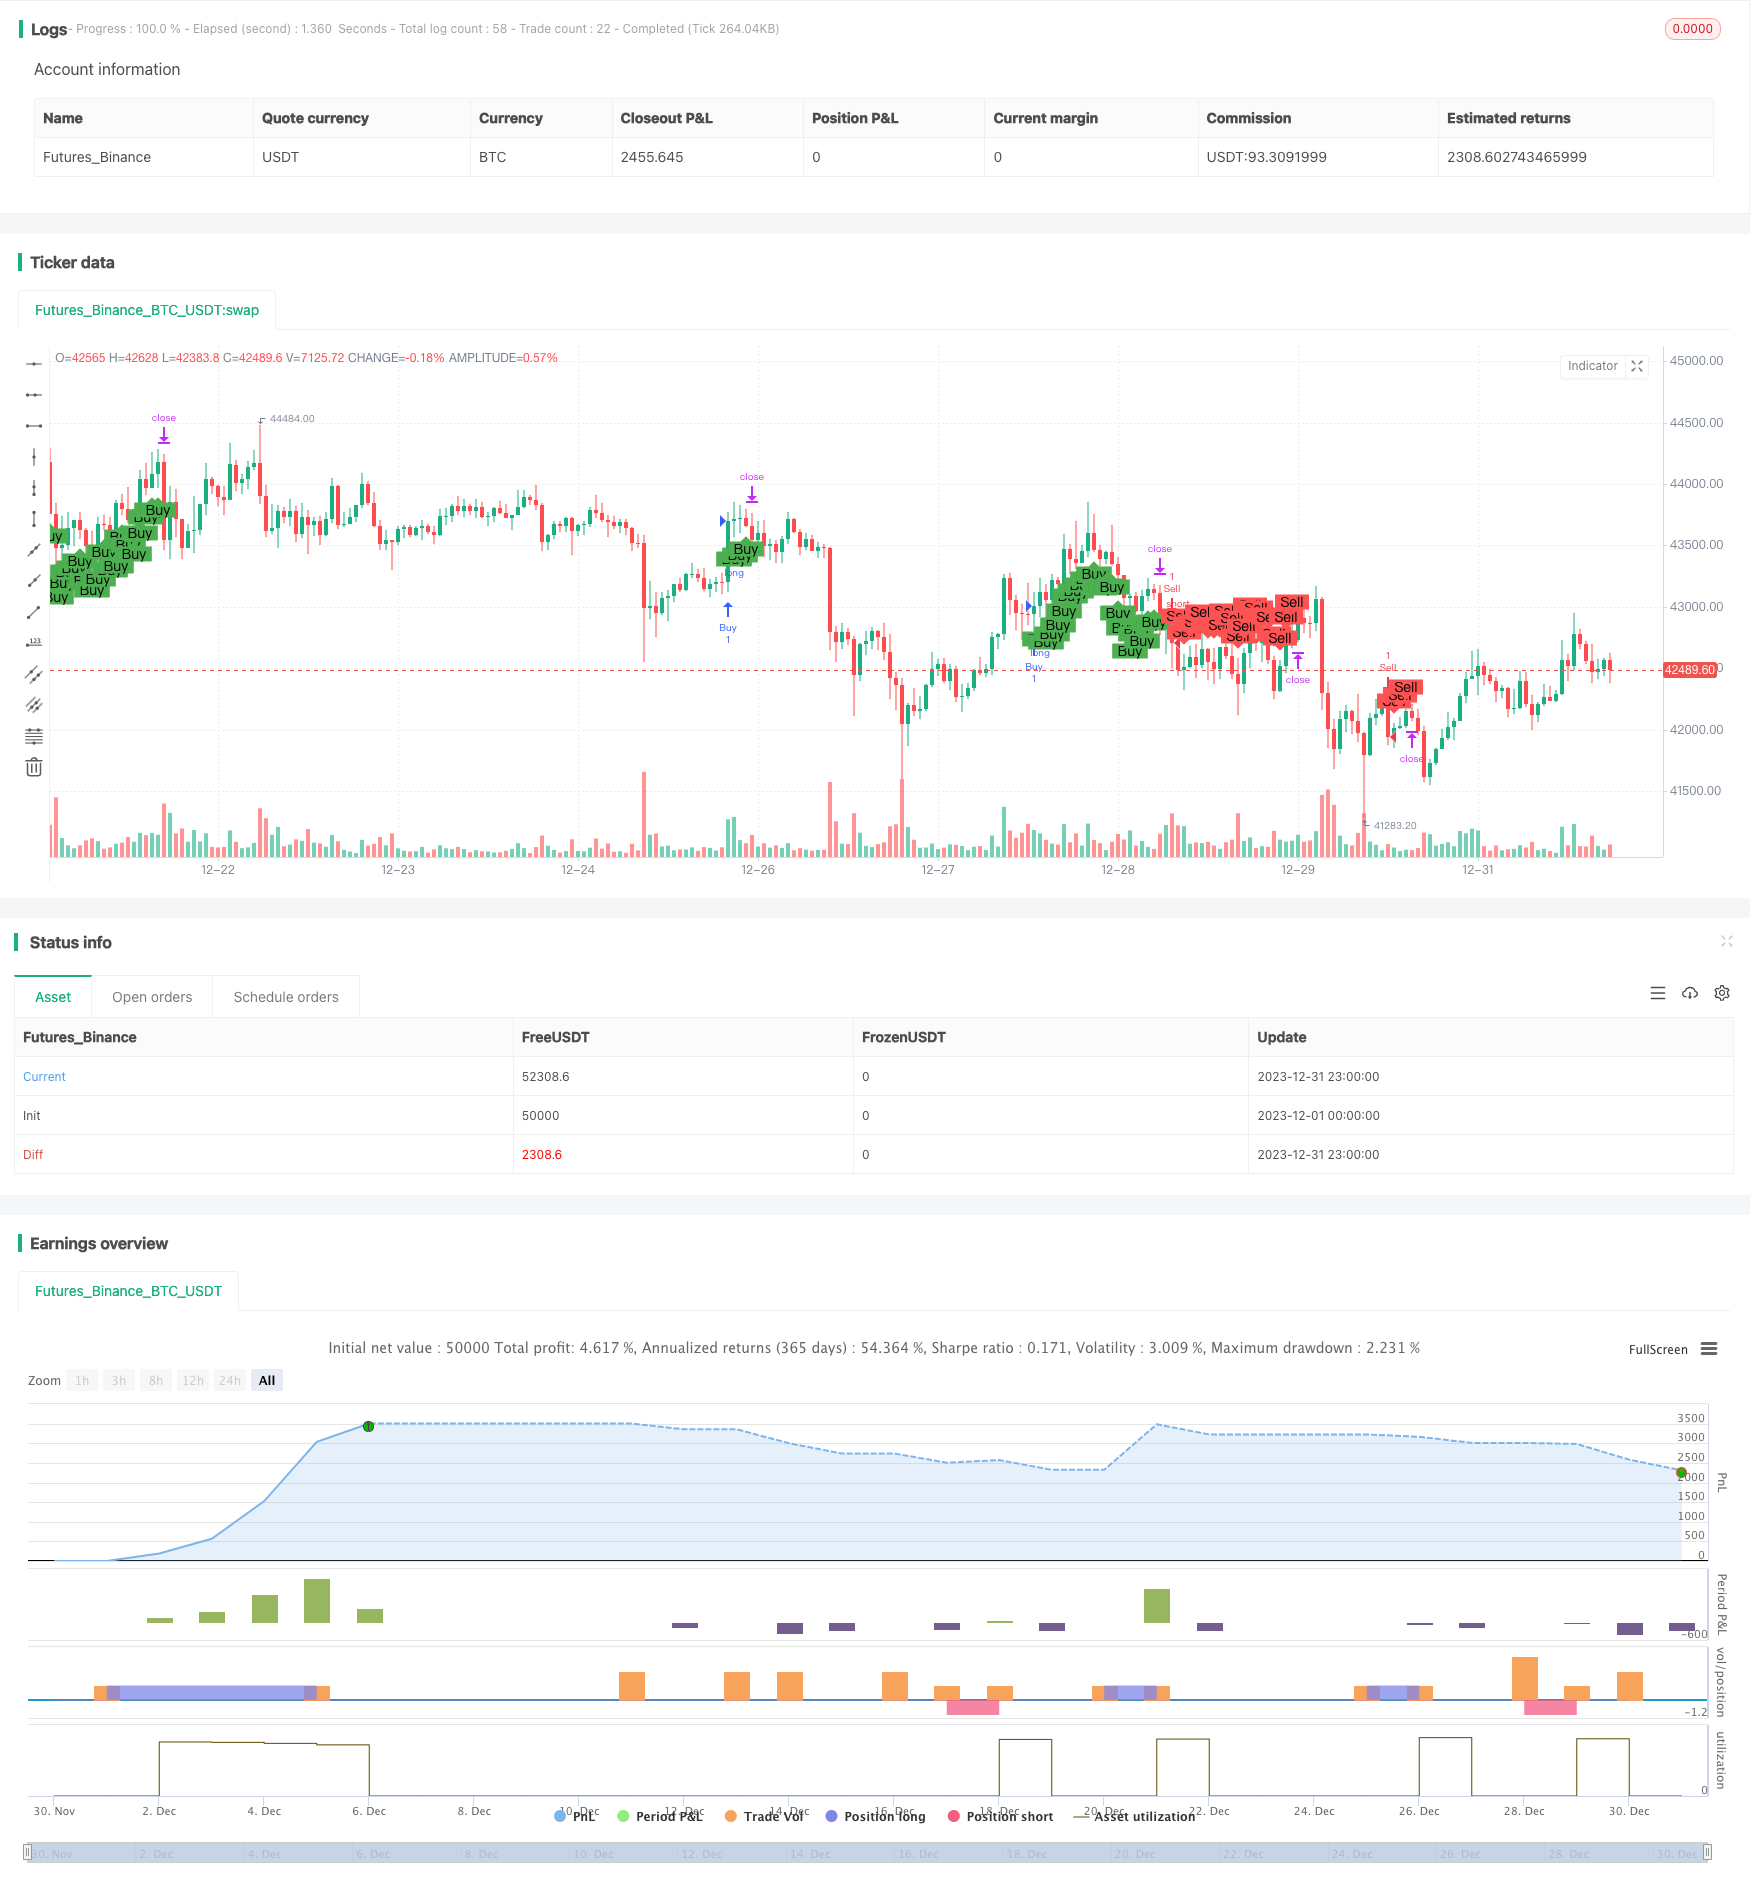
概述:本策略是一个利用布林通道,KDJ指标以及趋势跟踪进行价格突破操作的策略。它可以在突破点进行买入和卖出操作,并设置止损线来控制风险。
策略原理:
- 计算15日和30日的简单移动平均线,以判断价格趋势。
- 计算布林通道上下轨,并结合K线实体突破布林通道上下轨来判断买入和卖出时机。
- 结合随机指标RSI判断是否超买超卖。RSI大于50为超买信号,RSI小于50为超卖信号。
- 当价格上涨突破布林通道上轨,且RSI大于50时产生买入信号;当价格下跌突破布林通道下轨,且RSI小于50时产生卖出信号。
- 设置ATR止损来控制风险。
优势分析:
- 该策略综合运用布林通道、RSI指标等多个指标来确定交易信号,可以有效避免因单一指标而造成交易信号的错误。
- 结合趋势判断,避免在盘整和反转中产生错误的交易信号。
- 设置ATR止损来控制每单的风险。
- 策略操作清晰简单,容易理解实现。
风险与改进:
- 布林通道作为一个轮廓指标,它的上下轨并不是绝对的支撑和阻力位,价格突破上下轨后可能会出现止损被击穿的情况。可以设置更宽松的止损点,或采用时间止损等其他止损策略。
- RSI指标在某些市场中可能会失效。可以考虑结合其他指标如KDJ、MACD等来实现更可靠的超买超卖判断。
- 反转和盘整市场中,容易产生错误信号。可以考虑加入趋势过滤,只在趋势明显的情况下参与操作。
优化建议:
- 测试并优化布林通道的周期数和标准差参数,使之更符合不同品种的特性。
- 测试并优化RSI的周期参数。
- 测试其他止损策略,如追踪止损、时间止损等。
- 结合更多趋势判断指标和信号指标,构建多因子模型。
总结:
本策略综合运用布林通道、RSI等多个指标判断买入和卖出时机,在保证一定的交易信号准确性的同时,也设置了止损来控制风险。但仍需针对具体品种进行参数优化,使信号更加准确可靠。此外,也可以考虑加入更多因子构建多因子模型。总的来说,该策略提供了一个相对简单、实用的价格突破操作思路,值得进一步研究优化。
策略源码
/*backtest
start: 2023-12-01 00:00:00
end: 2023-12-31 23:59:59
period: 1h
basePeriod: 15m
exchanges: [{"eid":"Futures_Binance","currency":"BTC_USDT"}]
*/

//@version=4
strategy("Custom Strategy", overlay=true)

length = 14
mult = 0.75
atr = atr(length) * mult

// Moving averages
ma15 = sma(close, 15)
ma30 = sma(close, 30)

// Bullish Engulfing pattern
bullishEngulfing = close[1] < open[1] and close > open and close[1] < open and close > open[1]

// Bearish Engulfing pattern
bearishEngulfing = close[1] > open[1] and close < open and close[1] > open and close < open[1]

// RSI
rsi = rsi(close, length)

// Buy condition
if (bullishEngulfing and close[1] > ma15 and rsi > 50)
    strategy.entry("Buy", strategy.long)
    strategy.exit("Sell", "Buy", stop=close - atr)

// Sell condition
if (bearishEngulfing and close[1] < ma15 and rsi < 50)
    strategy.entry("Sell", strategy.short)
    strategy.exit("Cover", "Sell", stop=close + atr)

// Plotting
plotshape(series=strategy.position_size > 0, title="Buy", location=location.belowbar, color=color.green, style=shape.labelup, text="Buy")
plotshape(series=strategy.position_size < 0, title="Sell", location=location.abovebar, color=color.red, style=shape.labeldown, text="Sell")