本文将介绍一种基于5EMA指标的短线突破反转交易策略。该策略主要利用5EMA指标判断价格趋势,在价格突破EMA时进行反转交易。
策略概述
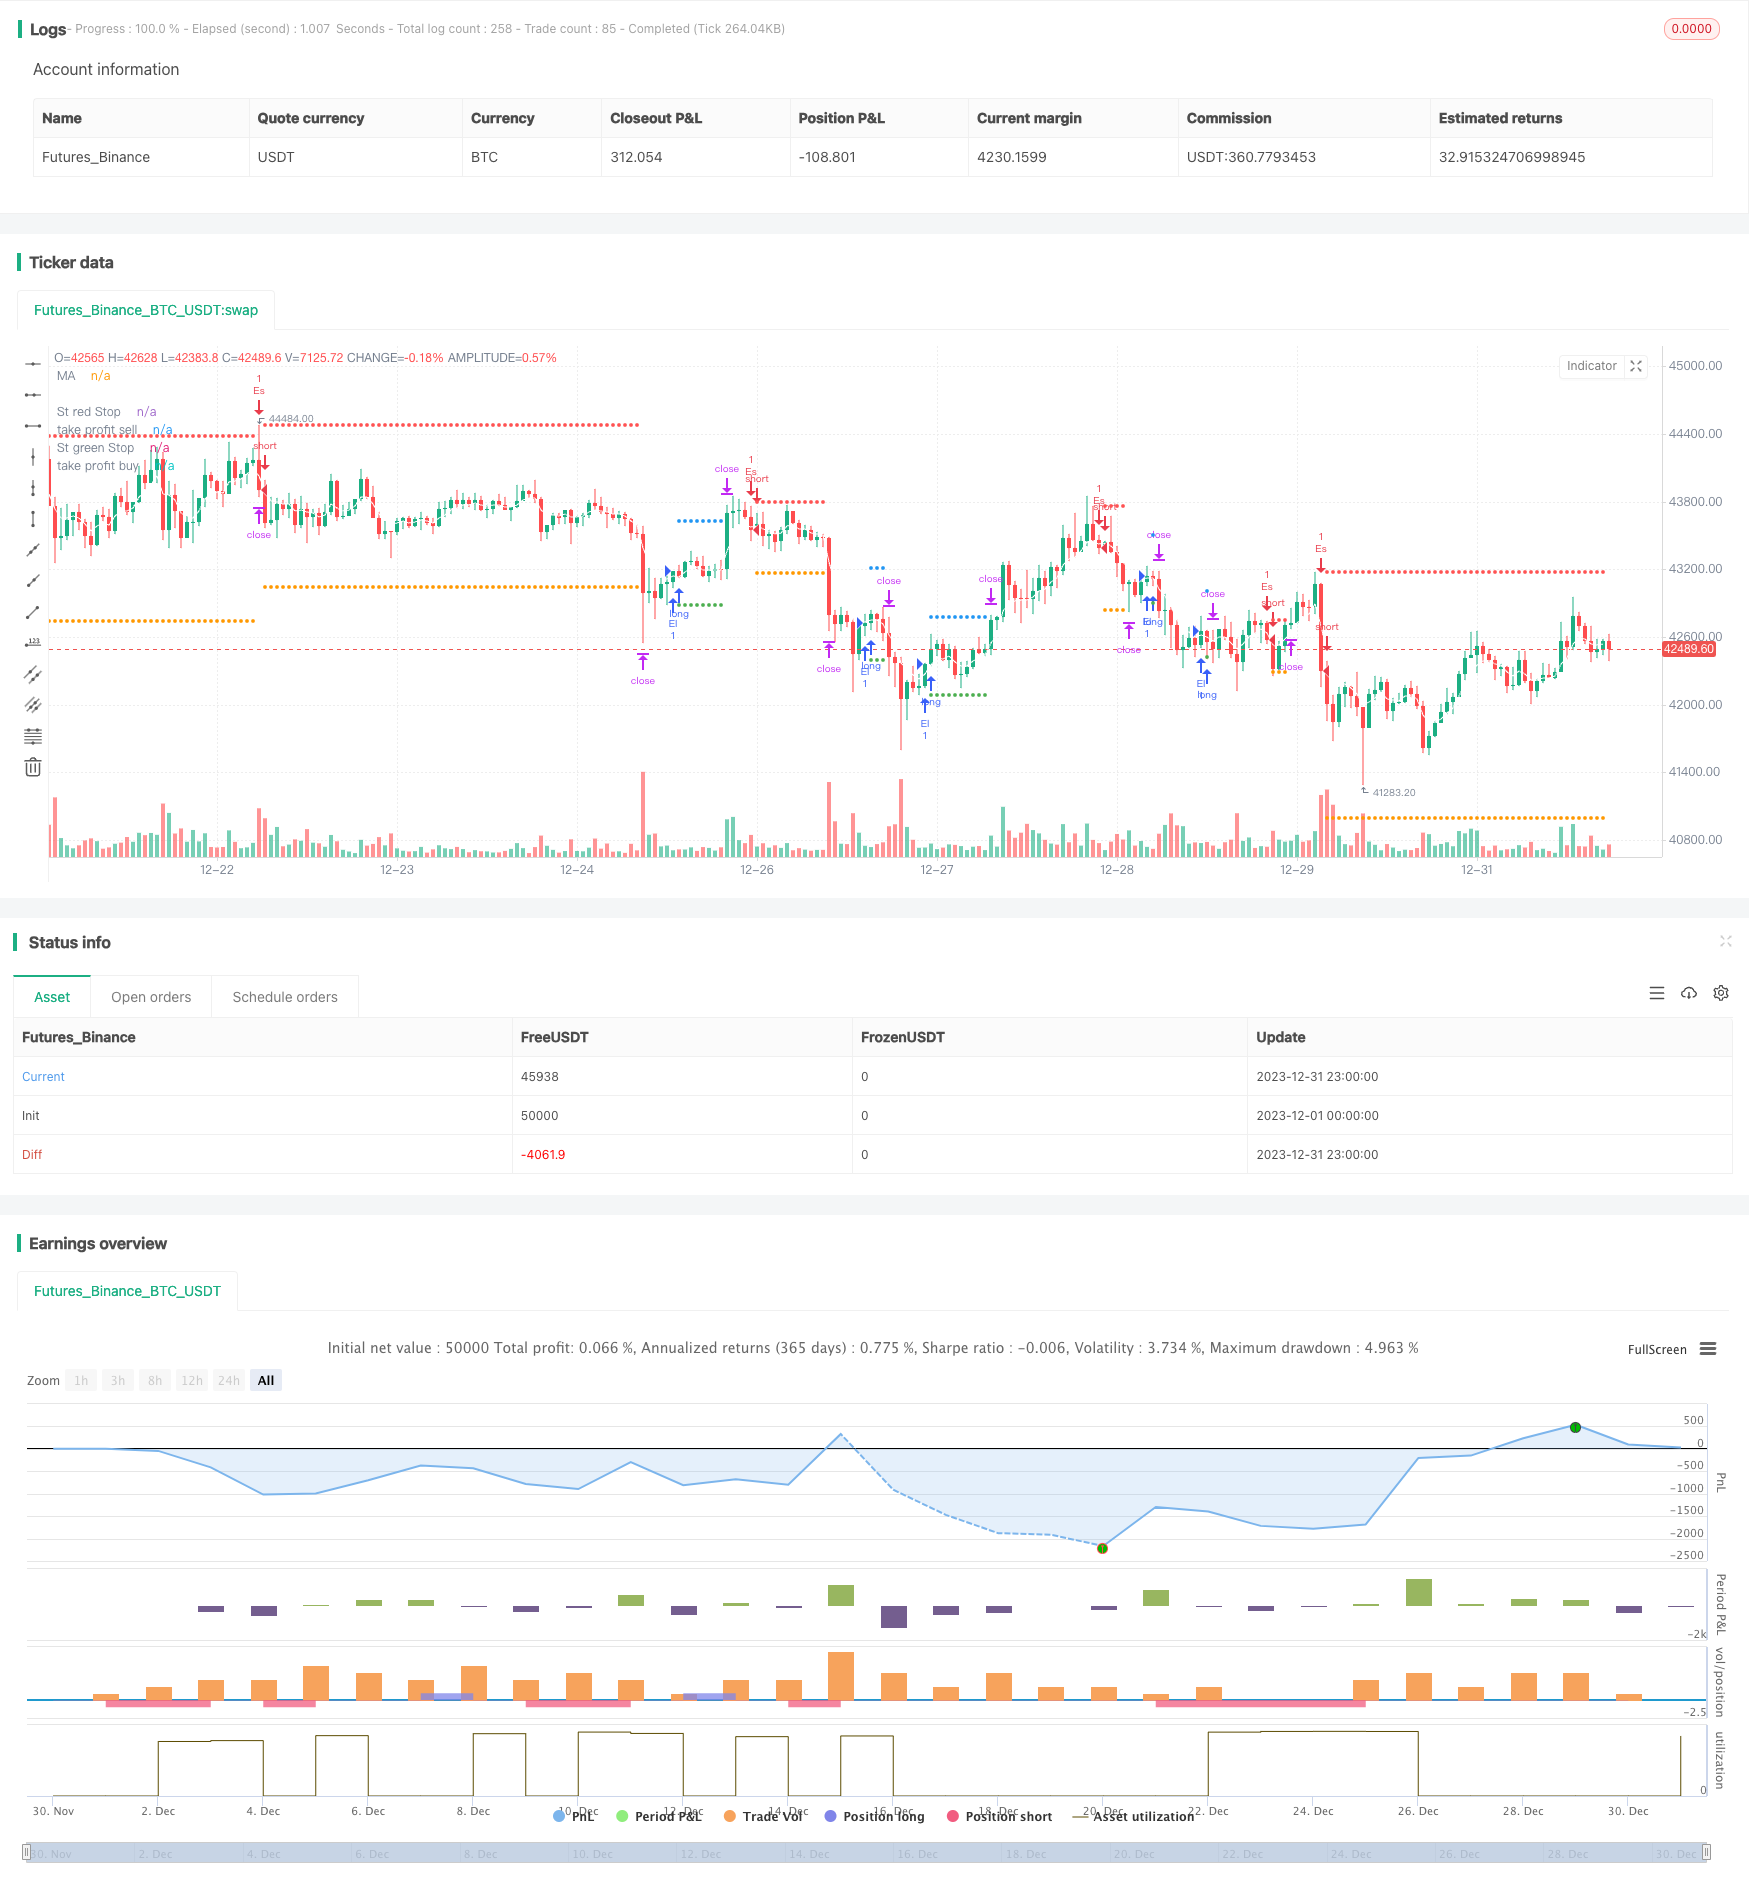
该策略是一个短线量化策略,主要用于高频交易。策略会同时判断多头和空头信号,可以进行双向交易。当价格突破5EMA指标时产生交易信号,根据突破的方向进入做多或做空头寸。
策略优势在于捕捉短线价格反转机会,快速进入场内。风险主要来自于假突破造成的损失。可通过优化参数降低损失风险。
策略原理
使用5周期EMA指标判断价格短期趋势
判断价格是否突破EMA指标
价格从上向下突破EMA时,产生卖出信号
价格从下向上突破EMA时,产生买入信号
设置止损和止盈点,限制单笔损失
由于EMA指标能够有效判断短期趋势,当价格出现明显反转时能快速捕捉交易机会。5EMA的参数较为灵活,对市场反应迅速,适合高频交易。
策略优势
- 反应迅速,适合高频捕捉短线交易机会
- 双向交易,可以同时做多做空
- 止损止盈设置合理,单笔损失有限制
- 简单的参数设置,容易实现策略优化
策略风险与解决方案
- 假突破风险造成不必要损失
- 优化EMA周期参数,确保指标稳定
- 交易频率过高容易追高杀跌
- 限制每天最大交易次数
策略优化方向
- 优化EMA指标参数,寻找最佳周期组合
- 增加 filter 减少假突破概率
- 限制每天最大交易次数
- 结合其他指标判断趋势方向
总结
本策略总体来说是一个非常实用的短线突破策略。利用EMA指标判断价格反转非常简单有效,是量化交易的一个重要工具。通过参数优化和风控设置,可以大幅提高策略胜率,值得推荐。
策略源码
/*backtest
start: 2023-12-01 00:00:00
end: 2023-12-31 23:59:59
period: 1h
basePeriod: 15m
exchanges: [{"eid":"Futures_Binance","currency":"BTC_USDT"}]
*/

// This Pine Script™ code is subject to the terms of the Mozilla Public License 2.0 at https://mozilla.org/MPL/2.0/
// © samscripter

//@version=5
strategy("5 ema strategy",overlay = true,process_orders_on_close = true)

// Choose trade direction

t_dir = input.string("Both", title="Trade Direction",options=["Long", "Short", "Both"],group = 'Trade Direction Set')

long_side  = t_dir == "Long" or t_dir == "Both"
short_side = t_dir == "Short" or t_dir == "Both"

// number of trade
mx_num =input.int(4,title = 'number Of trade',group = 'Maximum Number Of Trade')
var hi =0.0
var lo =0.0

var group_ma1="Ema Set"

//Ema 1
on_ma=input.bool(true,"Enable EMa 1 Plot On/Off"  ,group =group_ma1)
ma_len= input.int(5, minval=1, title="Ema Length",group =group_ma1)
ma_src = input.source(close, title="Ema Source"   ,group = group_ma1)
ma_out = ta.ema(ma_src, ma_len)

// buy and sell ema condition
plot(on_ma?ma_out:na, color=color.white, title="MA")


if close>ma_out and open>ma_out and low>ma_out and high>ma_out
    lo:=low

if close<ma_out and open<ma_out and low<ma_out and high<ma_out
    hi:=high

// condition when price is crossunder lo take sell and when price crossoing hi take buy
var buyp_sl =float(na)
var sellp_sl =float(na)

//count number trade since day stra
var count_buysell=0

if  close>hi[1]
    if strategy.position_size==0 and count_buysell<mx_num and long_side
        strategy.entry('El',strategy.long,comment = 'Long')
        count_buysell:=count_buysell+1
        buyp_sl:=math.min(low,low[1])
    hi:=na
if  close<lo[1]
    if strategy.position_size==0 and count_buysell<mx_num and short_side
        strategy.entry('Es',strategy.short,comment = 'short')
        count_buysell:=count_buysell+1
        sellp_sl:=math.max(high,high[1])
    lo:=na

//take profit multiply

tpnew = input.float(title="take profit", step=0.1, defval=1.5, group='Tp/SL')


//stop loss previous candle high and previous candle low
buy_sl = ta.valuewhen(strategy.position_size != 0 and strategy.position_size[1] == 0,buyp_sl , 0)
sell_sl= ta.valuewhen(strategy.position_size != 0 and strategy.position_size[1] == 0,sellp_sl, 0)

//take profit
takeProfit_buy = strategy.position_avg_price - ((buy_sl - strategy.position_avg_price) *tpnew)
takeProfit_sell = strategy.position_avg_price - ((sell_sl - strategy.position_avg_price) *tpnew)


//  Submit exit orders
if strategy.position_size > 0
    strategy.exit(id='XL', stop=buy_sl,limit=takeProfit_buy,comment_loss = 'Long Sl',comment_profit = 'Long Tp')

if strategy.position_size < 0
    strategy.exit(id='XS', stop=sell_sl,limit=takeProfit_sell,comment_loss = 'Short Sl',comment_profit = 'Short Tp')

//plot data
plot(series=strategy.position_size < 0 ?sell_sl : na, style=plot.style_circles, color=color.red, linewidth=2, title="St red Stop")
plot(series=strategy.position_size > 0 ?buy_sl  : na, style=plot.style_circles, color=color.green, linewidth=2, title="St green Stop")


// plot take profit
plot(series=strategy.position_size < 0 ? takeProfit_sell : na, style=plot.style_circles, color=color.orange, linewidth=2, title="take profit sell")
plot(series=strategy.position_size > 0 ? takeProfit_buy: na, style=plot.style_circles, color=color.blue, linewidth=2, title="take profit buy")

if ta.change(time('D'))
    count_buysell:=0