概述
真实相对运动MA均线策略(True Relative Movement Moving Average, TRMMA)是一个结合相对强弱指数(RSI)和真实强弱指数(TSI)的趋势跟踪策略。它利用 RSI 和 TSI 的指标为买入和卖出信号,辅以移动平均线进行策略优化。
策略原理
该策略主要分为以下几部分:
TSI 计算 通过双指数平滑计算价格变化率的指数平滑值,再除以价格变化率绝对值的指数平滑值,得到 TSI 指标。其中长期为25天,短期为5天,信号线为14天。
RSI 计算 以收盘价为价格输入,长度为5的 RSI 指标。
信号判断 当 TSI 上穿其信号线且 RSI 上穿50时为买入信号。当 TSI 下穿其信号线且 RSI 下穿50时为卖出信号。
K线颜色 根据信号判断给K线染色,辅助判断。
策略参数 设置仓位比例和资金等参数。
优势分析
该策略结合 TSI 和 RSI 两个指标,能够有效判断市场趋势和超买超卖情况,从而产生交易信号。相比单一使用 TSI 或 RSI,能够过滤掉更多假信号。此外,相比默认参数,本策略采用更加激进的 TSI 和 RSI 参数设置,可以获得更早且高质量的交易信号。
风险分析
该策略主要存在以下风险:
参数优化风险。不同市场、不同品种、不同周期下,TSI 和 RSI 的最优参数都可能不同,需要针对具体情况优化。
趋势反转风险。策略本身侧重趋势,一旦发生突发事件引起短期调整或中长期趋势反转,该策略将面临较大亏损。
信号频繁风险。相比默认参数,本策略采用更加激进的参数设置,可能会产生更为频繁的交易信号,带来更高的交易成本和实现难度。
优化方向
该策略可以从以下几个方面进行优化:
结合移动均线等指标进一步过滤信号,以减少频繁交易的问题。
测试不同市场和品种下 TSI 和 RSI 参数的最优组合,寻找最佳参数设置。
增加止损策略,以控制单笔亏损风险。
优化仓位管理,在趋势较强时加大仓位,趋势转弱时减小仓位。
总结
TRMMA 策略结合 TSI 和 RSI 指标判断买入卖出时机,对趋势具有很强的捕捉能力。相比单一使用 TSI 或 RSI,能有效过滤假信号。通过参数优化、止损策略、仓位管理等方式可进一步增强策略稳定性。该策略适合具有一定量化基础且追求高收益的投资者。
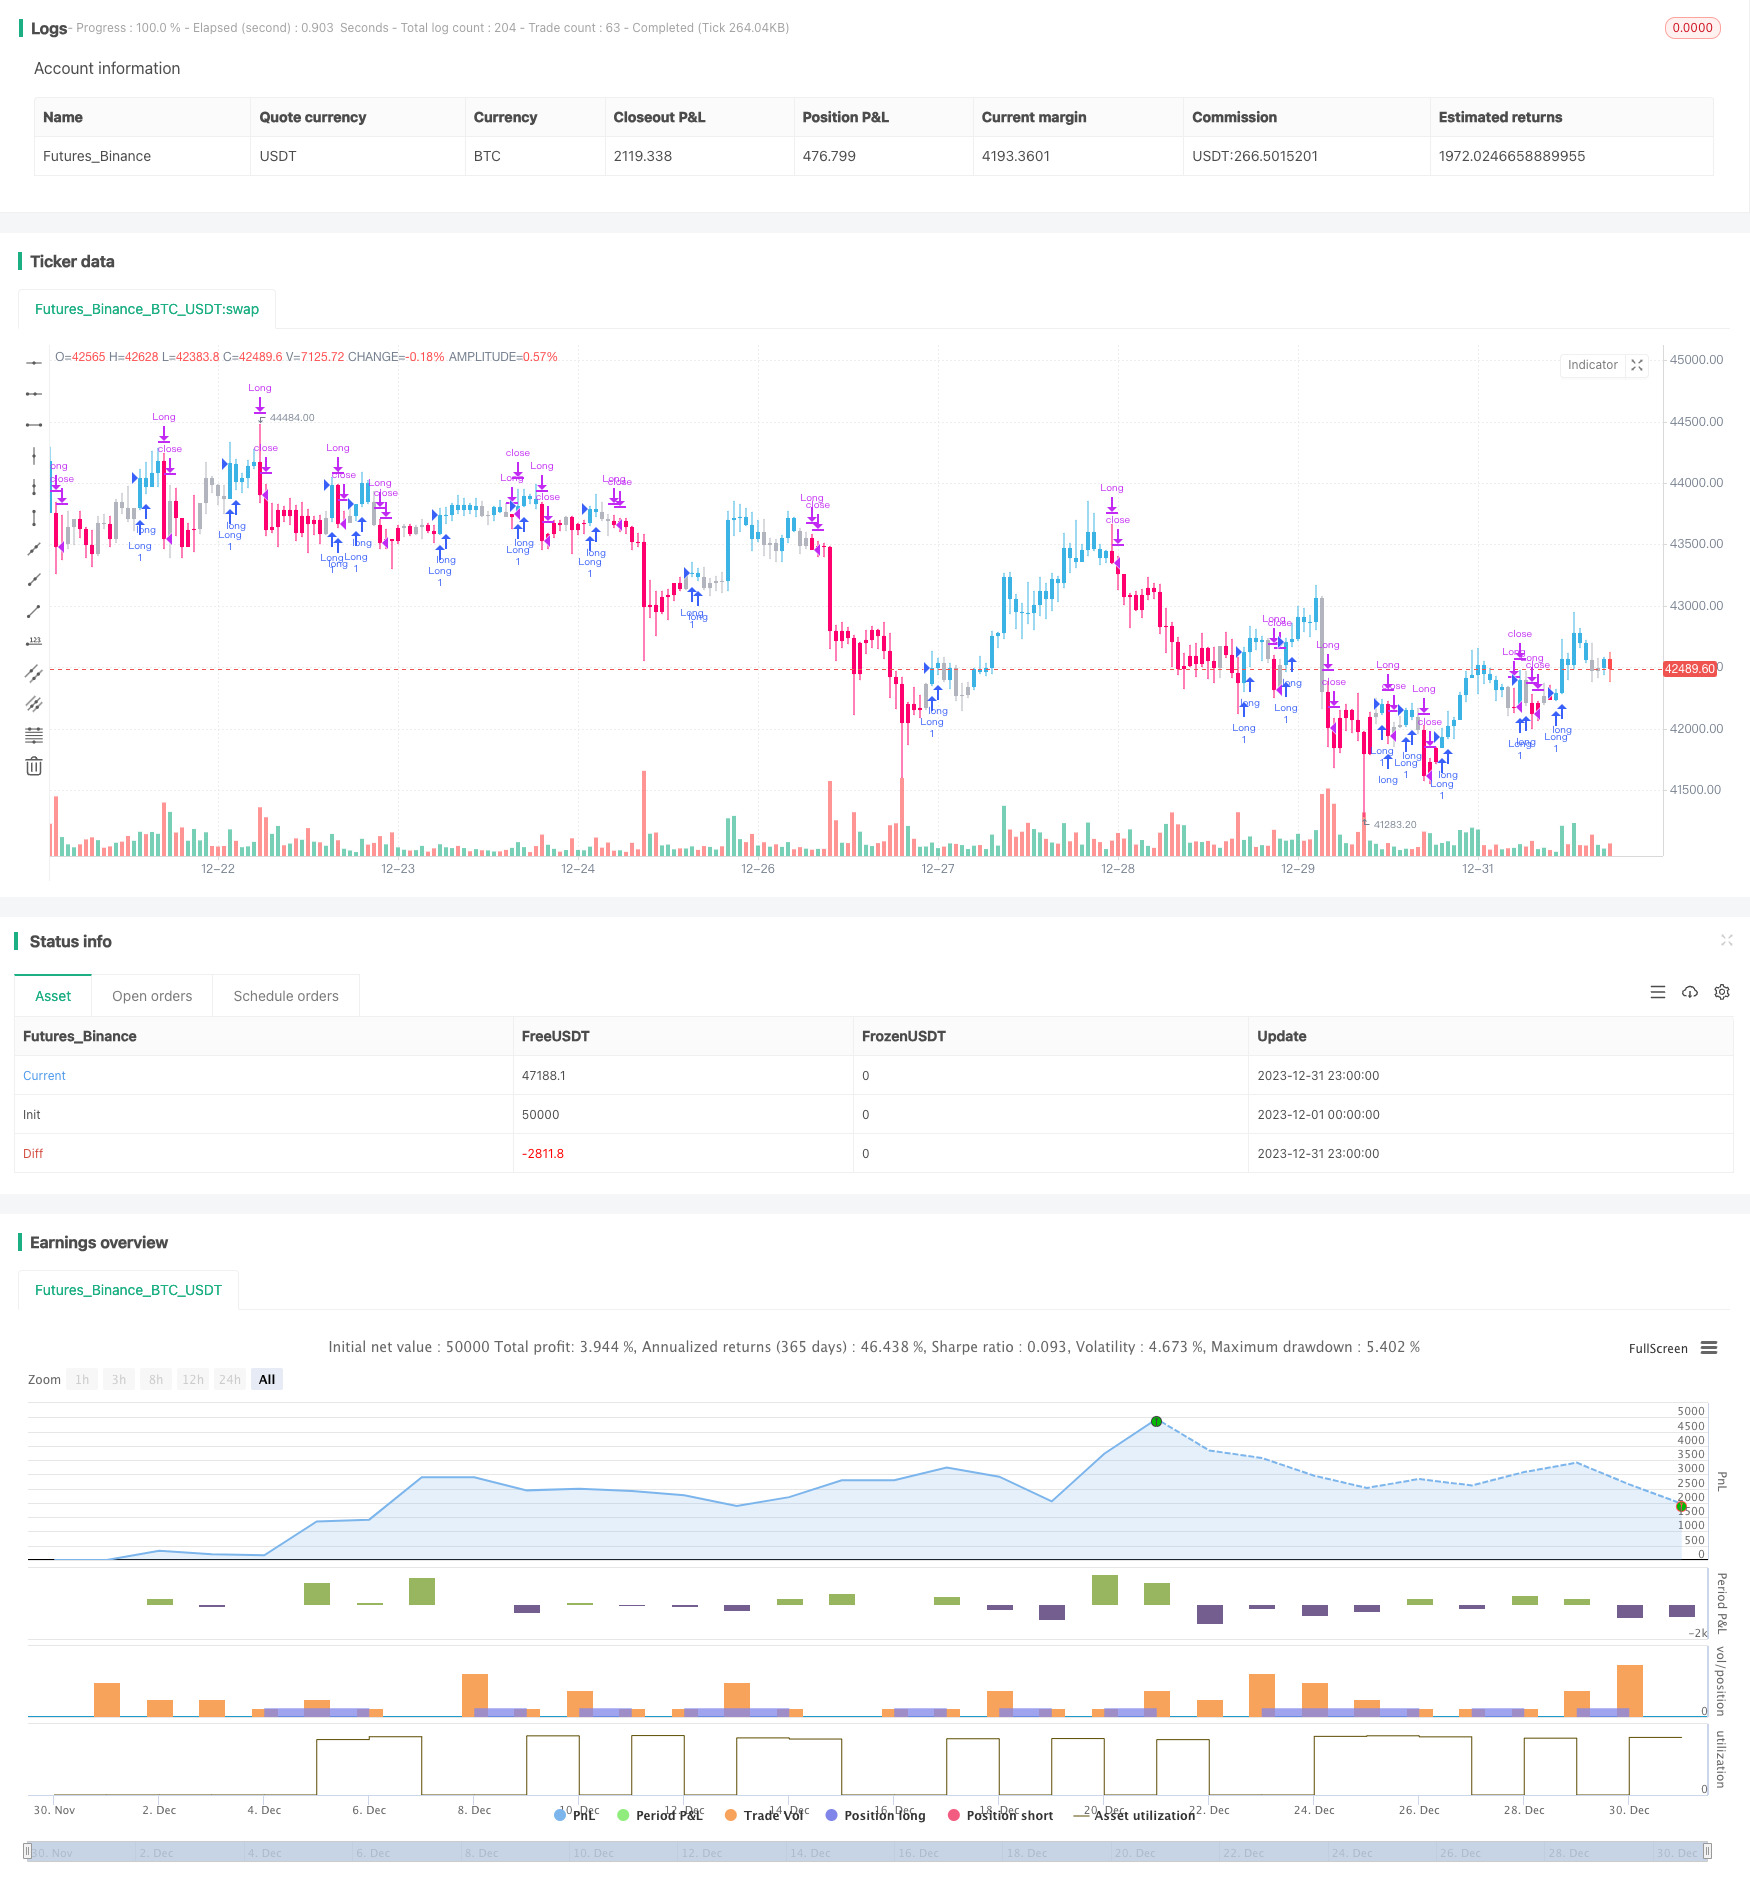
/*backtest
start: 2023-12-01 00:00:00
end: 2023-12-31 23:59:59
period: 1h
basePeriod: 15m
exchanges: [{"eid":"Futures_Binance","currency":"BTC_USDT"}]
*/

// "True relative Movement" or "TRM" for short is a system that combines my two favorite indicators: RSI and TSI. I strived to put together an indicator that combined the best of both
// in order to help discretionary traders predict market direction, weakness and strength. As with most technical indicators there are "Buy and sell" signals. Similiar to Elder Impulse system,
///TRM paints bars 3 different colors to display 3 different conditions: Blue for "Buy", Pink for "Sell", and gray for "Take profit/Hold". When the bars turn blue, that means all conditions
/// have been met. When they turn pink, no conditions have been met. When they are gray, only one condition has been met. The system is simple, yet effective. A buy signal is prodcued when
/// TSI is above the signal line, and RSI is above 50, and vice versa for sell signals. I have modified the default parameters for TSI and RSI for more "aggressive" entries and exits. I may later on
/// name this condition "Fast-TRM" and "Slow-TRM" for when default settings for TSI and RSI are applies, as this is a very robust system as well.

///******ES 1HR, 15MIN/5MIN SYSTEM***** Go long, when all time frame on a buy signal and vice versa. Take profit when the 5 min chart flips to buy or sell depending on what side of the trade you are on. Close or flip
//// long/short when time all time frames flip to Buy/Hold if short and Sell/Hold if long. Use 20EMA for additional confirmation.

//@version=4
strategy("TKP-TRM Strategy", overlay=true)
Note = input( 0, title = "TSI standard values are 25, 13, 13, and RSI is 14. Can change the default values to these for 'Slow TRM'")
long = input(title="TSI-Long Length", type=input.integer, defval=25)
short = input(title="TSI-Short Length", type=input.integer, defval=5)
signal = input(title="TSI-Signal Length", type=input.integer, defval=14)
price = close
double_smooth(src, long, short) =>
    fist_smooth = ema(src, long)
    ema(fist_smooth, short)
pc = change(price)
double_smoothed_pc = double_smooth(pc, long, short)
double_smoothed_abs_pc = double_smooth(abs(pc), long, short)
tsi_value = 100 * (double_smoothed_pc / double_smoothed_abs_pc)
TSI_Signal_Line = (ema(tsi_value, signal))


/////////////////////////////RSI////////////////////////////////////////////////

src = close, len = input(5, minval=1, title="RSILength")
up = rma(max(change(src), 0), len)
down = rma(-min(change(src), 0), len)
rsi = down == 0 ? 100 : up == 0 ? 0 : 100 - (100 / (1 + up / down))
rsiBuyfilterlevel = input(50, minval = 1, title = "RSI cross above Buy Level")
rsiSellfilterlevel = input(50, minval = 1, title = "RSI cross below Sell Level")

////////////////////////////Bar Coloring//////////////////////////////////////////////////////////

TRM_Buy = ((tsi_value > TSI_Signal_Line) and (rsi > rsiBuyfilterlevel))
TRM_Sell = ( (tsi_value < TSI_Signal_Line) and (rsi <rsiSellfilterlevel))
TRM_Color = TRM_Buy? #3BB3E4 : TRM_Sell? #FF006E : #b2b5be
barcolor(TRM_Color)


///////////////////////////Strategy Paramters////////////////////////////////////////

if (TRM_Buy)
    strategy.entry("Long", strategy.long, comment="Long")

if (TRM_Sell)
    strategy.close("Long", comment="Sell")