概述
双MACD量化交易策略是一种利用双时间框架MACD指标实现的量化交易策略。该策略在周线MACD指标形成金叉时开仓做多,在日线MACD指标形成死叉时平仓。当仓位为空时,若日线MACD指标再次形成金叉,则可以重新开仓做多。
策略原理
双MACD量化交易策略利用周MACD指标和日MACD指标的组合来判断入场和出场信号。
首先,当周MACD指标的MACD线上穿信号线时产生买入信号,此时开仓做多;然后当日MACD指标的MACD线下穿信号线时产生卖出信号,此时平仓。
当仓位为空时,若日MACD指标的MACD线再次上穿信号线,则重新开仓做多。也就是说,日MACD指标的金叉成为再次开仓的条件。
需要注意的是,日MACD指标的死叉才会平仓,但必须在周MACD指标MACD线高于信号线的“交易窗口”内才允许再次开仓。
策略优势
双MACD量化交易策略结合了双时间框架分析,可以有效过滤假信号,提高信号的质量。具体来说,主要有以下几个优势:
周时间框架判断主要趋势方向,有助于避免逆势交易。
日时间框架判断入场和出场时机,可以及时捕捉短期交易机会。
“交易窗口”机制可以避免因短期调整而过于频繁开仓平仓。
MACD指标参数可调,可以根据不同品种和市场环境进行优化。
整合止盈、止损、移动止损功能,可以有效控制风险。
策略风险
双MACD量化交易策略也存在一定的风险,主要包括:
MACD指标容易产生假信号和频繁交叉,需要组合其他指标进行确认。
周月时间框架判断的主要趋势可能发生转折,需要及时止损。
Parameters需要根据不同品种和行情环境不断优化和调整。
不能过度依赖回测结果,实盘可能与回测有差异。
对应解决方法:
与其他指标组合使用,构建逻辑优化的策略体系。
设置合理的止损幅度,避免超过可承受的最大损失。
不断优化参数,寻找最佳参数组合。
从最小资金开始实盘,验证策略稳定性。
优化方向
双MACD量化交易策略还有进一步优化的空间:
可以引入布林线、KDJ等其他指标,构建多指标组合策略,提高信号质量。
可以结合交易量指标,避免价格上涨但成交量不足的假突破。
可以利用机器学习方法自动优化参数,实现参数的动态调整。
可以针对策略作进一步风险调整,如加入盈亏比等高级止损方法。
策略拟合性检验与优化调整,避免过拟合问题。
总结
双MACD量化交易策略整合双时间框架分析判断主副趋势,以发挥各自指标优势。策略优化空间还很大,有望通过引入其他指标、利用机器学习进行参数优化等方法进一步提升策略效果。实盘验证是必不可少的一步,也是进一步完善策略的重要依据。
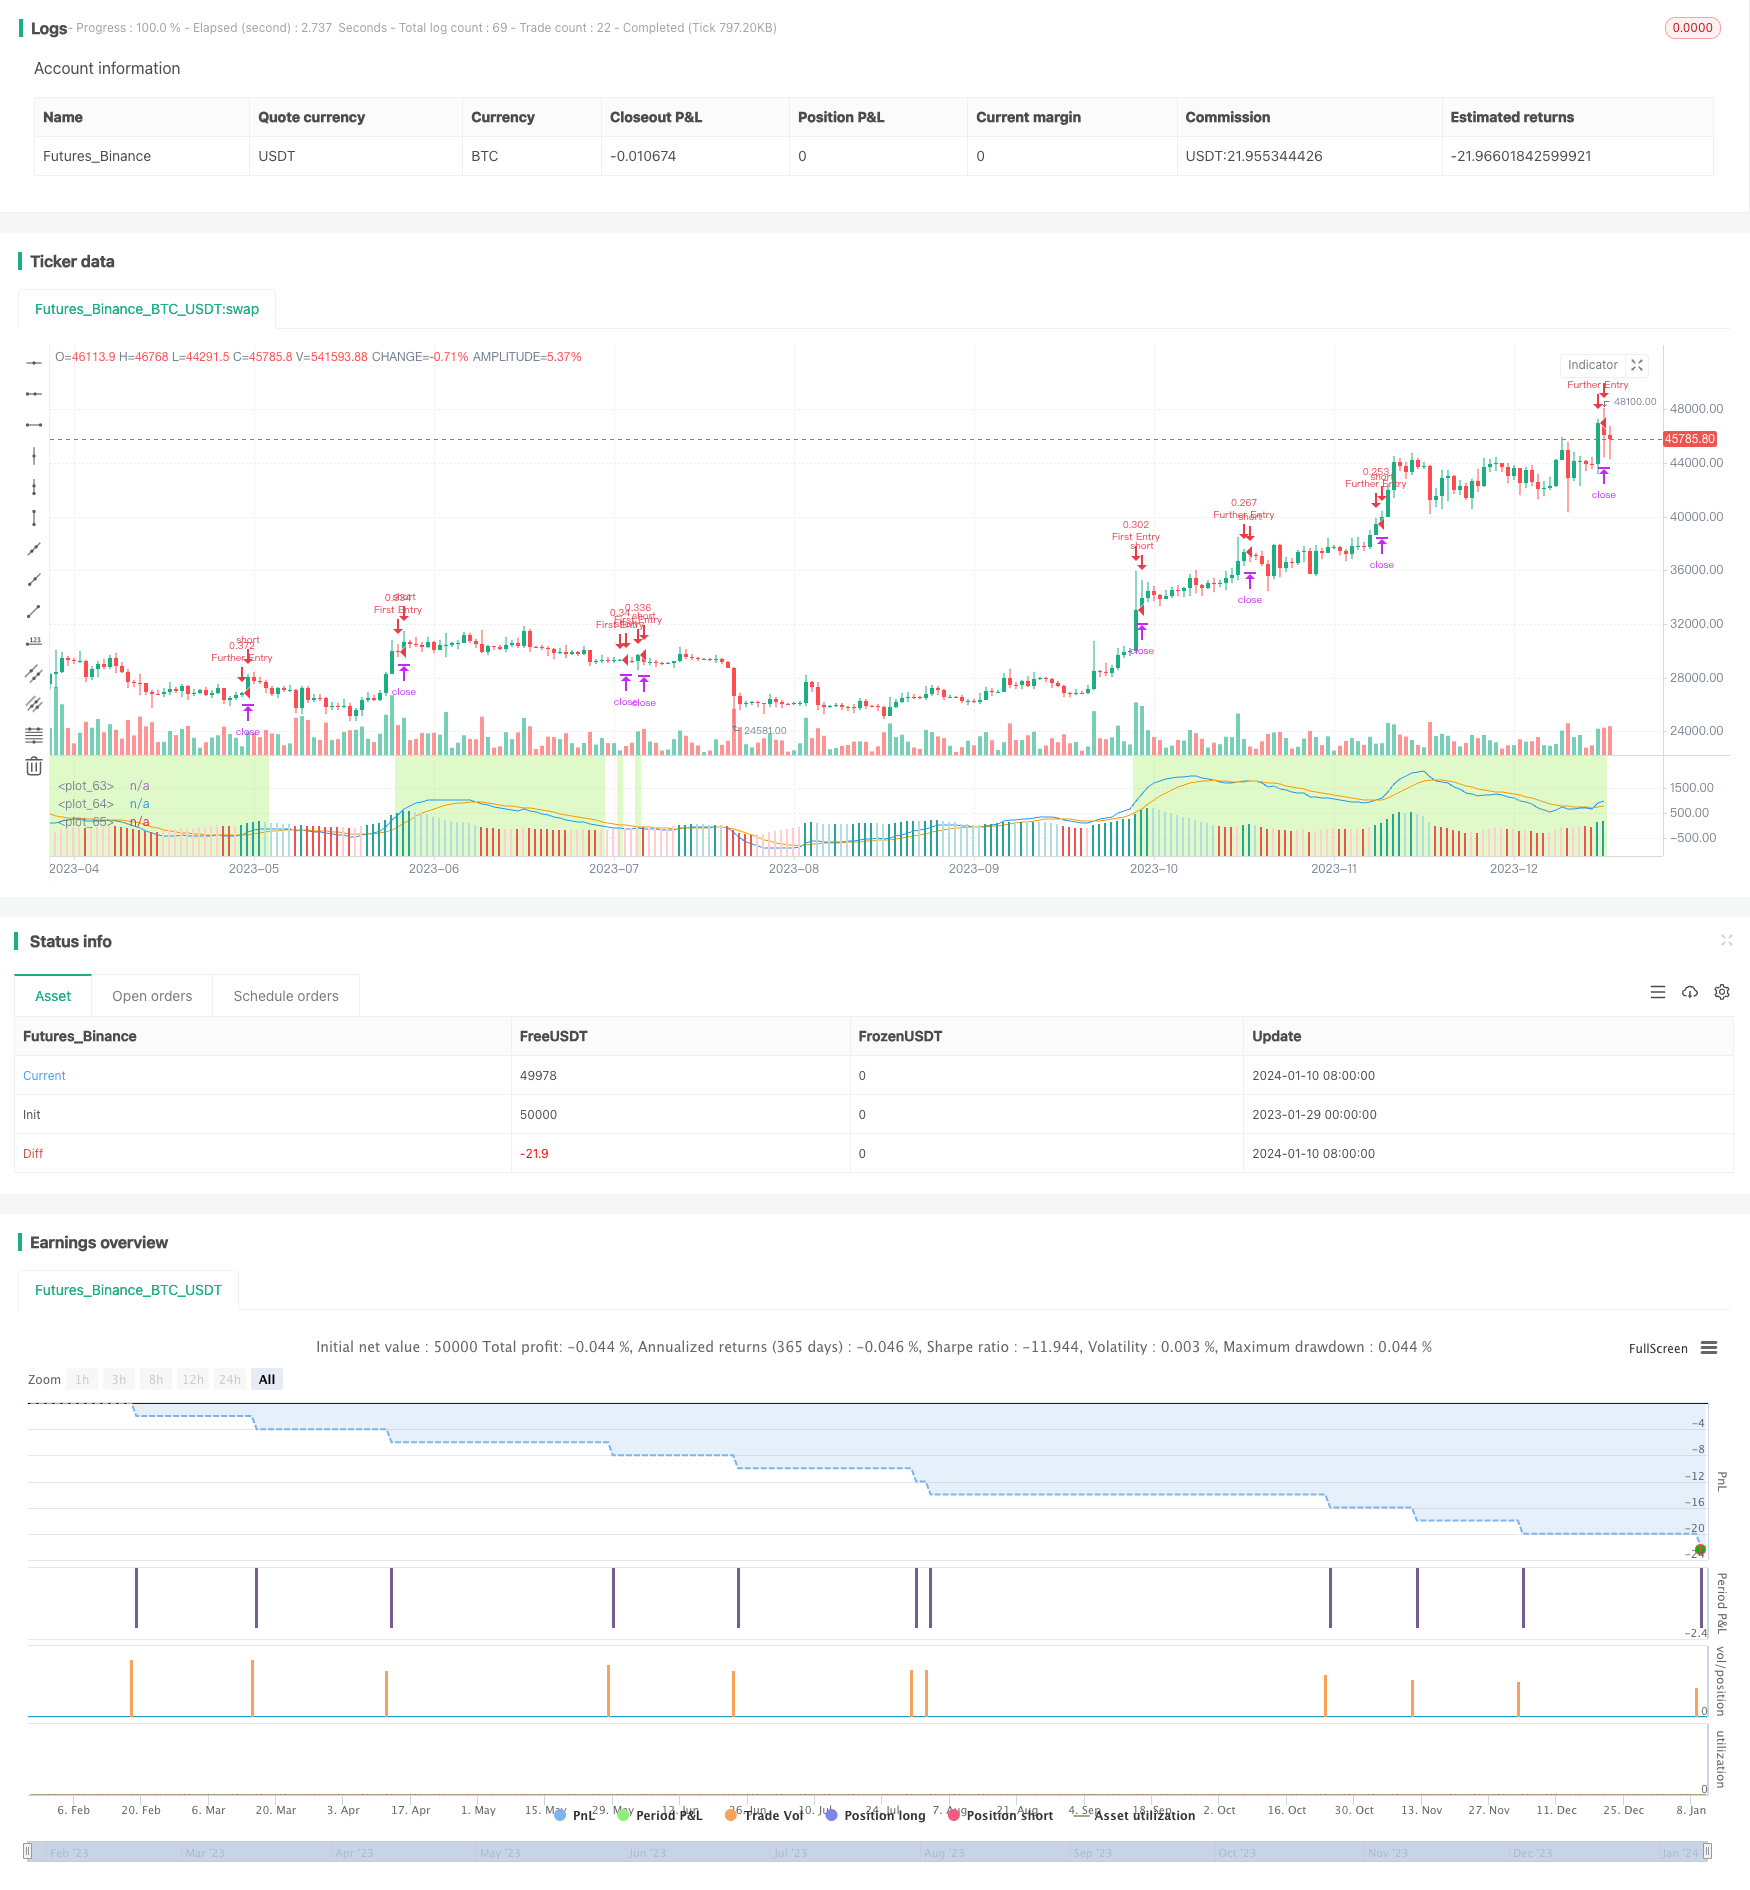
/*backtest
start: 2023-01-29 00:00:00
end: 2024-01-11 05:20:00
period: 1d
basePeriod: 1h
exchanges: [{"eid":"Futures_Binance","currency":"BTC_USDT"}]
*/

// This source code is subject to the terms of the Mozilla Public License 2.0 at https://mozilla.org/MPL/2.0/
// © maxits

// Long Position: Weekly Macd line crosses above Signal line
// [Trading Window Macd Line > Signal Line] (Weekly)
// Close Position: Daily Macd Line crosses above Daily Signal line.
// Re Entry Condition: Macd line crosses above Signal line only if [Trading Window MacdLine > Sgnal Line] (Weekly)

//@version=4
strategy("Dual MACD Strategy",
         shorttitle="Dual Macd Tester",
         overlay=false,
         initial_capital=1000,
         default_qty_value=20,
         default_qty_type=strategy.percent_of_equity,
         commission_value=0.1,
         pyramiding=0)


// Define user inputs
i_time     = input(defval = timestamp("01 May 2018 13:30 +0000"), title = "Start Time", type = input.time) // Starting  time for Backtesting
f_time     = input(defval = timestamp("9 Sep 2021 13:30 +0000"), title = "Finish Time", type = input.time) // Finishing time for Backtesting

sep1          = input(false, title="------ Profit & Loss ------")

enable_TP     = input(true, title="Enable Just a Profit Level?")
enable_SL     = input(false, title="Enable Just a S.Loss Level?")
enable_TS     = input(true, title=" Enable Only Trailing Stop")
long_TP_Input = input(30.0,   title='Take Profit %',      type=input.float, minval=0)/100
long_SL_Input = input(1.0,   title='Stop Loss %',        type=input.float, minval=0)/100
long_TS_Input = input(5.0,   title='Trailing Stop %',    type=input.float, minval=0)/100
cl_low_Input  = input(low,   title="Trailing Stop Source")
long_TP       = strategy.position_avg_price * (1 + long_TP_Input)
long_SL       = strategy.position_avg_price * (1 - long_SL_Input)
long_TS       = cl_low_Input * (1 - long_TS_Input)

sep2       = input(false, title="------ Macd Properties ------")

d_res      = input(title="Short Term TimeFrame", type=input.resolution, defval="D") // Daily Time Frame
w_res      = input(title="Long Term TimeFrame", type=input.resolution, defval="W")  // Weekly Time Frame
src        = input(close, title="Source")                                           // Indicator Price Source
fast_len   = input(title="Fast Length", type=input.integer, defval=12)              // Fast MA Length
slow_len   = input(title="Slow Length", type=input.integer, defval=26)              // Slow MA Length
sign_len   = input(title="Sign Length", type=input.integer, defval=9)               // Sign MA Length
d_w        = input(title="Daily or Weekly?", type=input.bool, defval=true)          // Plot Daily or Weekly MACD

// Color Plot for Macd

col_grow_above = #26A69A
col_grow_below = #FFCDD2
col_fall_above = #B2DFDB
col_fall_below = #EF5350

// BG Color

bg_color = color.rgb(127, 232, 34, 75)

// Daily Macd

[d_macdLine, d_singleLine, d_histLine] = security(syminfo.tickerid, d_res, macd(src, fast_len, slow_len, sign_len)) // Funcion Security para poder usar correcta resolución

plot(d_w ? d_macdLine   : na, color=color.blue)
plot(d_w ? d_singleLine : na, color=color.orange)
plot(d_w ? d_histLine   : na, style=plot.style_columns,
     color=(d_histLine>=0 ? (d_histLine[1] < d_histLine ? col_grow_above : col_fall_above) :
     (d_histLine[1] < d_histLine ? col_grow_below : col_fall_below)))

// Weekly Macd

[w_macdLine, w_singleLine, w_histLine] = security(syminfo.tickerid, w_res, macd(src, fast_len, slow_len, sign_len)) // Funcion Security para poder usar correcta resolución

plot(d_w ? na : w_macdLine,   color=color.blue)
plot(d_w ? na : w_singleLine, color=color.orange)
plot(d_w ? na : w_histLine,   style=plot.style_columns,
     color=(w_histLine>=0 ? (w_histLine[1] < w_histLine ? col_grow_above : col_fall_above) :
     (w_histLine[1] < w_histLine ? col_grow_below : col_fall_below)))

///////////////////////////////// Entry Conditions
inTrade    = strategy.position_size != 0       // Posición abierta
notInTrade = strategy.position_size == 0       // Posición Cerrada
start_time = true

trading_window = w_macdLine > w_singleLine   // Weekly Macd Signal enables a trading window
bgcolor(trading_window ? bg_color : na)
buy_cond       = crossover (w_macdLine, w_singleLine)
sell_cond      = crossunder(d_macdLine, d_singleLine)
re_entry_cond  = crossover (d_macdLine, d_singleLine) and trading_window

// Entry Exit Conditions

trailing_stop  = 0.0        // Code for calculating Long Positions Trailing Stop Loss
trailing_stop := if (strategy.position_size != 0)
    stopValue = long_TS
    max(trailing_stop[1], stopValue)
else
    0

if (buy_cond and notInTrade and start_time)
    strategy.entry(id="First Entry", long=strategy.long, comment="First Long")

if (sell_cond and inTrade)
    strategy.close(id="First Entry", comment="Close First Long")

if (re_entry_cond and notInTrade and start_time)
    strategy.entry(id="Further Entry", long=strategy.long, comment="Further Entry")

if (sell_cond and inTrade)
    strategy.close(id="Further Entry", comment="Close First Long")

if enable_TP
    if (enable_TS and not enable_SL)
        strategy.exit("Long TP & TS FiEn", "First Entry",   limit = long_TP, stop = trailing_stop)
        strategy.exit("Long TP & TS FuEn", "Further Entry", limit = long_TP, stop = trailing_stop)
    else
        if (enable_SL and not enable_TS)
            strategy.exit("Long TP & TS FiEn", "First Entry",   limit = long_TP, stop = long_SL)
            strategy.exit("Long TP & TS FuEn", "Further Entry", limit = long_TP, stop = long_SL)
        else
            strategy.exit("Long TP & TS FiEn", "First Entry",   limit = long_TP)
            strategy.exit("Long TP & TS FuEn", "Further Entry", limit = long_TP)
else
    if not enable_TP
        if (enable_TS and not enable_SL)
            strategy.exit("Long TP & TS FiEn", "First Entry",   stop = trailing_stop)
            strategy.exit("Long TP & TS FuEn", "Further Entry", stop = trailing_stop)
        else
            if (enable_SL and not enable_TS)
                strategy.exit("Long TP & TS FiEn", "First Entry",   stop = long_SL)
                strategy.exit("Long TP & TS FuEn", "Further Entry", stop = long_SL)

plot(enable_TP ? long_TP : na, title="TP Level", color=color.green, style=plot.style_linebr, linewidth=2)
plot(enable_SL ? long_SL : na, title="SL Level", color=color.red,   style=plot.style_linebr, linewidth=2)
plot(enable_TS and trailing_stop ? trailing_stop : na, title="TS Level", color=color.red, style=plot.style_linebr, linewidth=2)