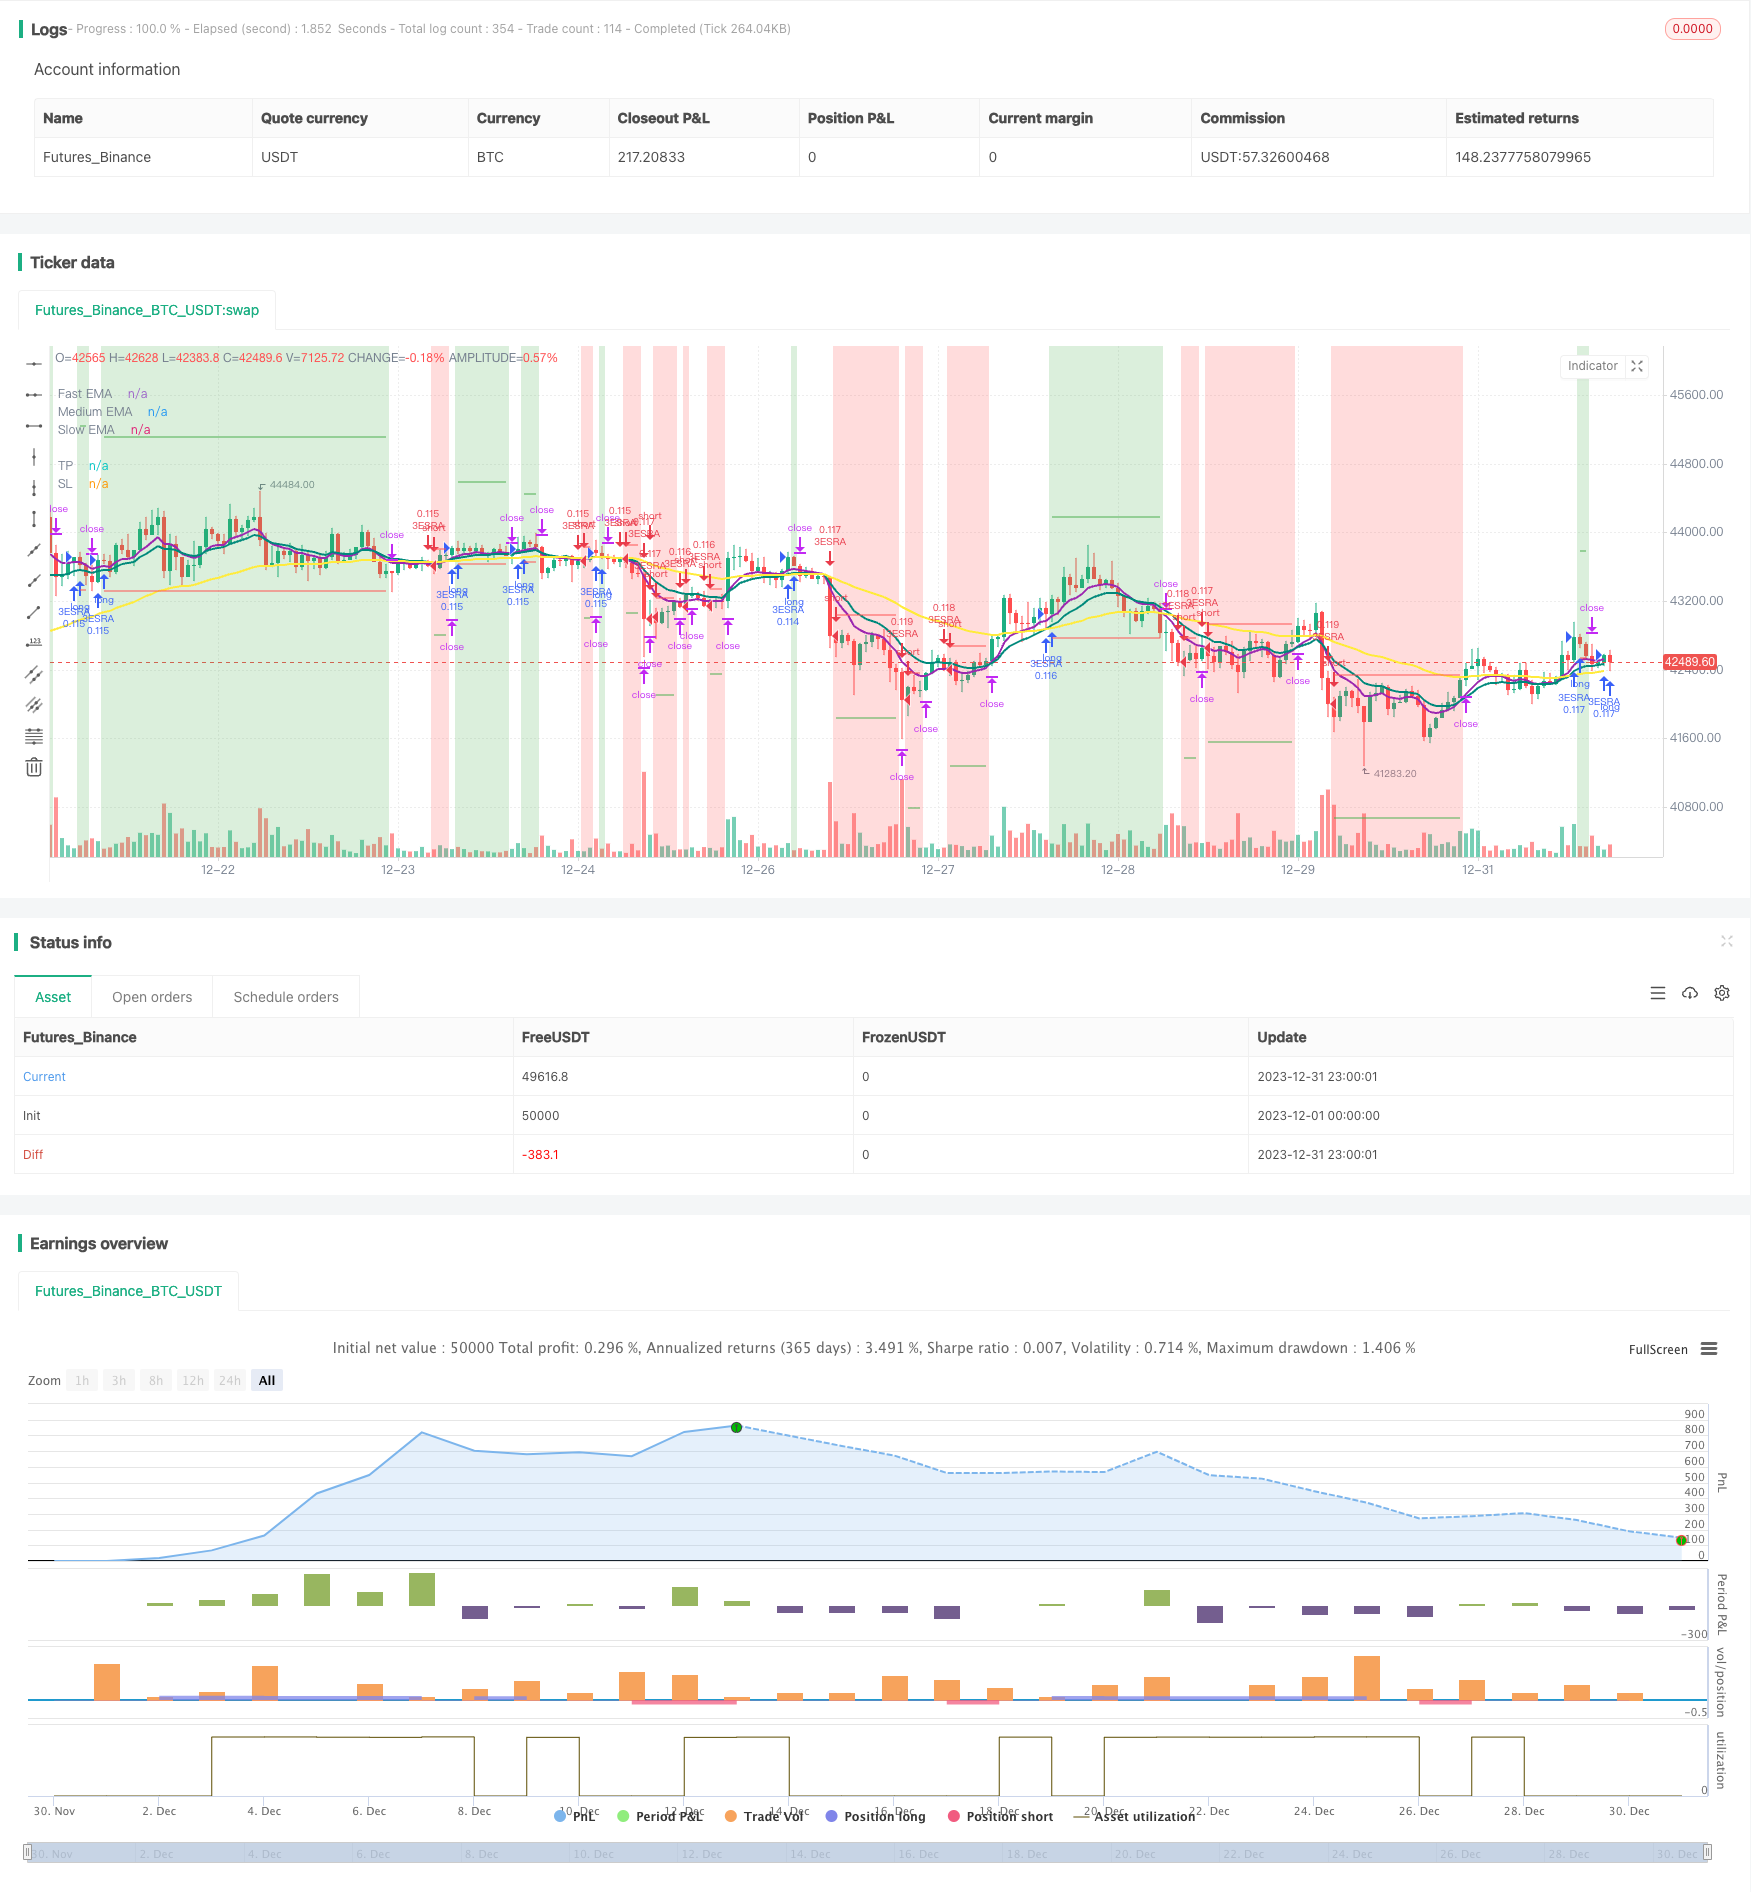
概述
该策略是一种趋势跟踪策略,结合了三重指数移动平均线指标和随机指数平滑移动平均线指标来产生交易信号。当快速移动平均线上穿中速移动平均线,中速移动平均线上穿慢速移动平均线时看多;当快速移动平均线下穿中速移动平均线,中速移动平均线下穿慢速移动平均线时看空。同时,该策略还引入随机指数平滑移动平均线指标作为辅助判断指标。
原理
使用8日、14日和50日三重指数移动平均线。当8日指数移动平均线上穿14日指数移动平均线,14日指数移动平均线上穿50日指数移动平均线时产生看多信号;反之,看空信号。
使用随机指数平滑移动平均线指标(Stochastic RSI)作为辅助判断指标。具体为:先计算14日RSI,然后在RSI指标的基础上再计算Stochastic指标,最后对Stochastic指标计算3日简单移动平均得到K线和3日简单移动平均得到D线。当K线上穿D线时,作为看多的辅助信号。
在产生交易信号时,如果价格高于8日指数移动平均线,则入场做多;如果价格低于8日指数移动平均线,则入场做空。
止损位于入场价下方/上方1倍ATR距离处。 止盈位于入场价上方/下方4倍ATR距离处。
优势
移动平均线作为基础指标,可以有效跟踪市场趋势。三重指数移动平均线通过组合使用多个周期,能够同时保证对短期和中长期趋势的敏感性。
增加Stochastic RSI作为辅助判断指标,可以过滤假信号,提高入场的准确性。
根据ATR来设置止损止盈位置,可以动态跟踪市场波动程度,避免止损止盈过大或过小。
该策略参数设置合理,在大趋势下表现优异。回撤较小,收益较为平稳,适合长线操作。
风险
多指标组合策略增加了反转的风险。当移动平均线和Stochastic RSI发出相反信号时,可能产生交易信号错误。这时需要关注价格本身的趋势性。
止损和止盈的设置比较保守,可能会在行情剧烈波动时被突破从而被止出,错过趋势机会。这时可以适当调整ATR参数或调大止损止盈的倍数。
由于使用了三重移动平均线,当快速线和中速线反转时,会有一定的滞后。这时需要关注价格本身是否反转以决定是否入场。
该策略主要适合趋势性行情,在盘整行情中表现不佳。这时可以考虑优化移动平均线的周期参数或使用其他判定指标。
优化
可以考虑加入MACD等其他指标,进一步优化入场时机。也可以测试不同参数的移动平均线组合。
可以对ATR多空检查的参数进行优化。例如将止损从1ATR调整为1.5ATR,止盈从4ATR调整为3ATR,看是否可以获得更佳收益。
可以测试只使用移动平均线,去掉Stochastic RSI指标,看是否可以过滤更多噪音,获得更稳定收益。
可以考虑加入更多条件来判断趋势,例如增加交易量指标,确保在大级别趋势中操作。
总结
该策略综合运用三重指数移动平均线和Stochastic RSI指标判定趋势方向。入场信号比较严格,可以有效减少无谓交易。止盈止损设置动态跟踪ATR,使得策略参数具有自适应性。从回测结果来看,该策略在趋势行情中表现优异,回撤较小,收益较为平稳。通过进一步优化,有望获得更好的效果。
/*backtest
start: 2023-12-01 00:00:00
end: 2023-12-31 23:59:59
period: 1h
basePeriod: 15m
exchanges: [{"eid":"Futures_Binance","currency":"BTC_USDT"}]
*/

//              3ESRA
//              v0.2a

// Coded by Vaida Bogdan

// 3ESRA consists of a 3 EMA cross + a close above (for longs) the quickest EMA
// or below (for shorts). Note that I've deactivated the RSI Cross Over/Under
// (you can modify the code and activate it). The strategy also uses a stop loss
// that's at 1 ATR distance from the entry price and a take profit that's at
// 4 times the ATR distance from the entry price.

// Feedback:
// Tested BTCUSDT Daily
// 1. Stoch-RSI makes you miss opportunities.
// 2. Changing RR to 4:1 times ATR works better.

//@version=4
strategy(title="3 EMA + Stochastic RSI + ATR", shorttitle="3ESRA", overlay=true, pyramiding=1,
     process_orders_on_close=true, calc_on_every_tick=true,
     initial_capital=1000, currency = currency.USD, default_qty_value=10,
     default_qty_type=strategy.percent_of_equity,
     commission_type=strategy.commission.percent, commission_value=0.1, slippage=2)

startDate = input(title="Start Date", type=input.integer,
     defval=1, minval=1, maxval=31, group="Backtesting range")
startMonth = input(title="Start Month", type=input.integer,
     defval=1, minval=1, maxval=12, group="Backtesting range")
startYear = input(title="Start Year", type=input.integer,
     defval=1900, minval=1800, maxval=2100, group="Backtesting range")
endDate = input(title="End Date", type=input.integer,
     defval=1, minval=1, maxval=31, group="Backtesting range")
endMonth = input(title="End Month", type=input.integer,
     defval=1, minval=1, maxval=12, group="Backtesting range")
endYear = input(title="End Year", type=input.integer,
     defval=2040, minval=1800, maxval=2100, group="Backtesting range")

// Date range filtering
inDateRange = (time >= timestamp(syminfo.timezone, startYear, startMonth, startDate, 0, 0)) and
     (time < timestamp(syminfo.timezone, endYear, endMonth, endDate, 23, 59))

fast = input(8, minval=8, title="Fast EMA", group="EMAs")
medium = input(14, minval=8, title="Medium EMA", group="EMAs")
slow = input(50, minval=8, title="Slow EMA", group="EMAs")
src = input(close, title="Source")

smoothK = input(3, "K", minval=1, group="Stoch-RSI", inline="K&D")
smoothD = input(3, "D", minval=1, group="Stoch-RSI", inline="K&D")
lengthRSI = input(14, "RSI Length", minval=1, group="Stoch-RSI", inline="length")
lengthStoch = input(14, "Stochastic Length", minval=1, group="Stoch-RSI", inline="length")
rsiSrc = input(close, title="RSI Source", group="Stoch-RSI")

length = input(title="Length", defval=14, minval=1, group="ATR")
smoothing = input(title="Smoothing", defval="RMA", options=["RMA", "SMA", "EMA", "WMA"], group="ATR")

// EMAs
fastema = ema(src, fast)
mediumema = ema(src, medium)
slowema = ema(src, slow)

// S-RSI
rsi1 = rsi(rsiSrc, lengthRSI)
k = sma(stoch(rsi1, rsi1, rsi1, lengthStoch), smoothK)
d = sma(k, smoothD)
sRsiCrossOver = k[1] < d[1] and k > d
sRsiCrossUnder = k[1] > d[1] and k < d

// ATR
ma_function(source, length) =>
	if smoothing == "RMA"
		rma(source, length)
	else
		if smoothing == "SMA"
			sma(source, length)
		else
			if smoothing == "EMA"
				ema(source, length)
			else
				wma(source, length)
atr = ma_function(tr(true), length)

// Trading Logic
longCond1 = (fastema > mediumema) and (mediumema > slowema)
longCond2 = true
// longCond2 = sRsiCrossOver
longCond3 = close > fastema
longCond4 = strategy.position_size <= 0
longCond = longCond1 and longCond2 and longCond3 and longCond4 and inDateRange

shortCond1 = (fastema < mediumema) and (mediumema < slowema)
shortCond2 = true
// shortCond2 = sRsiCrossUnder
shortCond3 = close < fastema
shortCond4 = strategy.position_size >= 0
shortCond = shortCond1 and shortCond2 and shortCond3 and shortCond4 and inDateRange

var takeProfit = float(na), var stopLoss = float(na)
if longCond and strategy.position_size <= 0
    takeProfit := close + 4*atr
    stopLoss := close - 1*atr
    // takeProfit := close + 2*atr
    // stopLoss := close - 3*atr

else if shortCond and strategy.position_size >= 0
    takeProfit := close - 4*atr
    stopLoss := close + 1*atr
    // takeProfit := close - 2*atr
    // stopLoss := close + 3*atr

// Strategy calls
strategy.entry("3ESRA", strategy.long, comment="Long", when=longCond and strategy.position_size <= 0)
strategy.entry("3ESRA", strategy.short, comment="Short", when=shortCond and strategy.position_size >= 0)
strategy.exit(id="TP-SL", from_entry="3ESRA", limit=takeProfit, stop=stopLoss)
if (not inDateRange)
    strategy.close_all()

// Plot EMAs
plot(fastema, color=color.purple, linewidth=2, title="Fast EMA")
plot(mediumema, color=color.teal, linewidth=2, title="Medium EMA")
plot(slowema, color=color.yellow, linewidth=2, title="Slow EMA")
// Plot S-RSI
// plotshape((strategy.position_size > 0) ? na : sRsiCrossOver, title="StochRSI Cross Over", style=shape.triangleup, location=location.belowbar, color=color.teal, text="SRSI", size=size.small)
// Plot trade
bgcolor(strategy.position_size > 0 ? color.new(color.green, 75) : strategy.position_size < 0 ? color.new(color.red,75) : color(na))
// Plot Strategy
plot((strategy.position_size != 0) ? takeProfit : na, style=plot.style_linebr, color=color.green, title="TP")
plot((strategy.position_size != 0) ? stopLoss : na, style=plot.style_linebr, color=color.red, title="SL")