概述
本策略是一个基于双向价格震荡突破的量化交易策略。它使用Pivot高低点作为价格关键支撑阻力位,并在价格突破Pivot高点的时候做多,突破Pivot低点的时候做空,实现双向操作。
策略原理
该策略的核心逻辑基于双向价格的关键点突破。具体来说,有以下几个步骤:
计算指定周期的Pivot高低点。这里使用ta.pivothigh()和ta.pivotlow()函数计算出最近2日内最高价作为高点,最近1日内最低价作为低点。
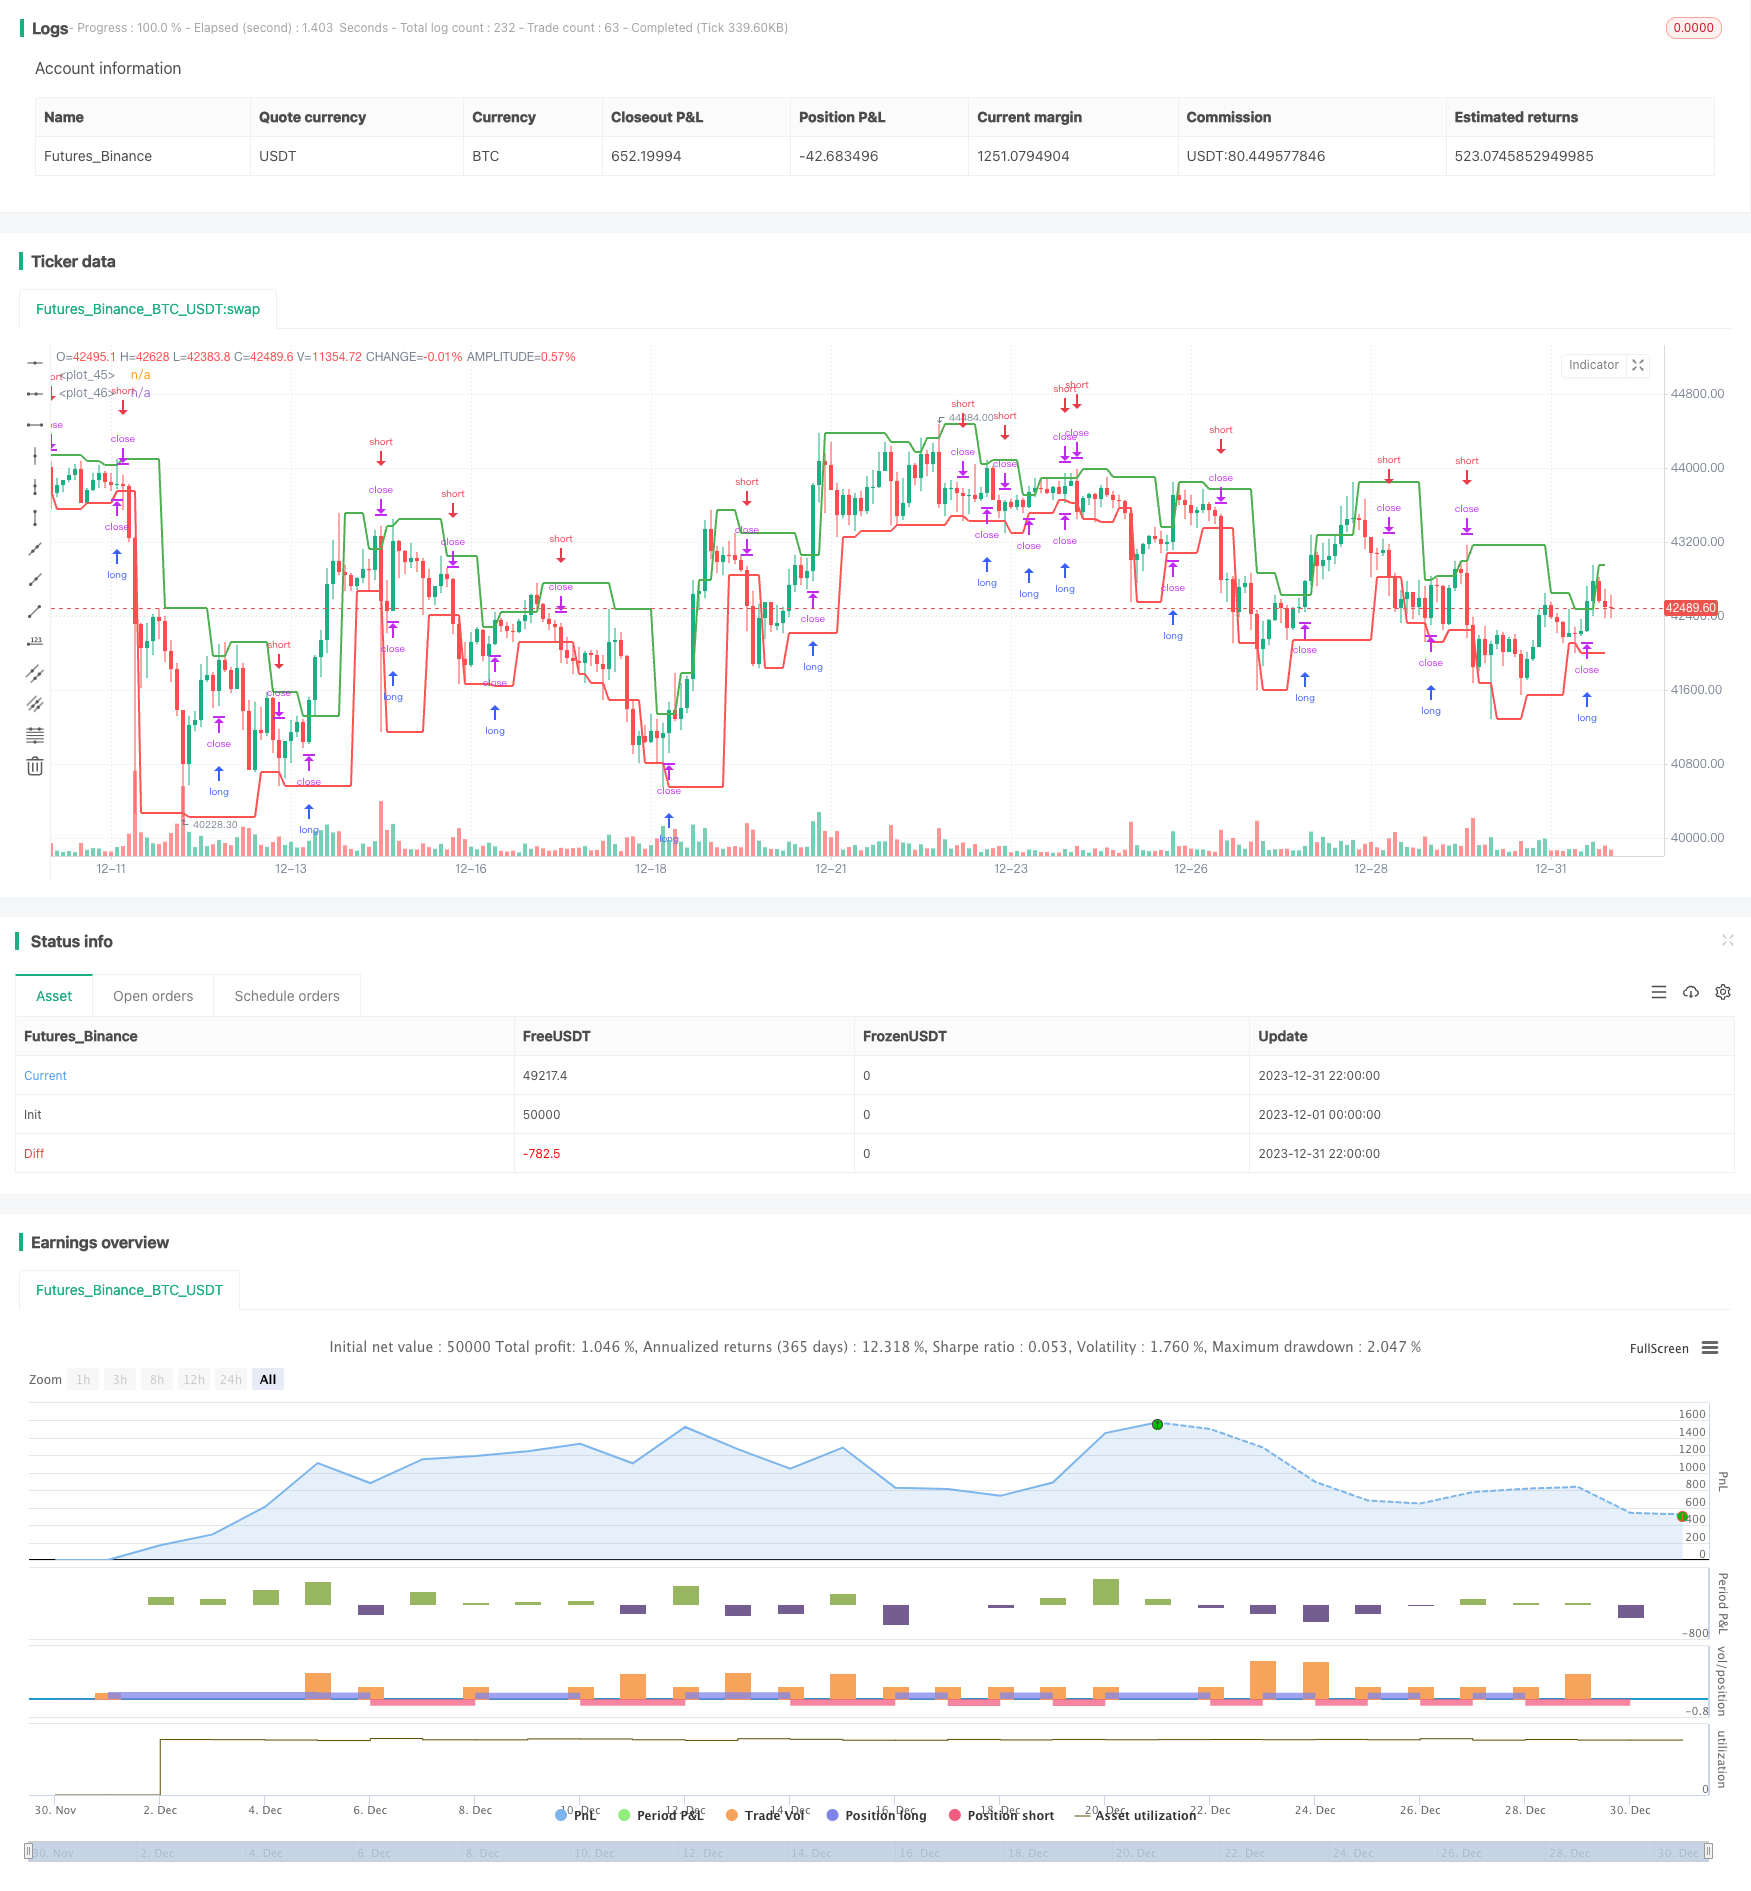
当价格突破上述计算出的关键高点时,做多入场。当价格突破关键低点时,做空入场。
使用止损单止损。做多时,止损价为高点+最小价格变动单位;做空时,止损价为低点-最小价格变动单位。
绘制关键的高低点,便于直观判断。
这样,当价格出现震荡的时候,能够在关键点突破的时候及时入场,并快速止损,从而获利。当价格不断突破新高或新低时,策略可以实现多次累积盈利。
优势分析
这种双向突破策略主要有以下几个优势:
简单易懂,容易实施。该策略仅仅依靠突破Pivot高低点来入场,非常简单。
容易设置止损。做多做空分别以高点低点+最小变动距离作为止损位,可以快速止损,有效控制风险。
能够双向操作。无论行情看涨看跌,该策略都可以顺势而为,累积盈利。
适合震荡行情。当价格出现频繁的上涨下跌时,策略可以频繁进入场内获得利润。
风险分析
尽管该策略有上述优点,但也存在一些风险需要注意:
关键点确定不当可能增加亏损。如果关键高低点设置不当,极端情况下可能追高杀跌。
震荡结束后可能开始亏损。当价格开始出现单边突破而不是震荡时,该策略则很难获利。
突破可能是短期的假突破。短期内也可能出现假突破,使得策略产生失误交易。
总的来说,该策略更适合在震荡行情中使用。投资者需要注意判断行情,避免在趋势行情中使用本策略。同时要注意防范关键点确定错误、假突破等问题造成的损失。
优化方向
考虑到上述风险,该策略的优化空间主要在以下几个方面:
智能选择关键高低点参数。可以通过机器学习等手段,让系统自动优化选择比较合适的关键点参数。
结合趋势判断。在策略基础上增加对趋势的判断逻辑,在震荡行情中使用该策略,在单边趋势中关闭策略,从而减少损失。
增加止损策略。可以设计更精细的止损策略,如移动止损、区间突破止损等,进一步控制风险。
总结
本策略是一个简单实用的双向突破策略。它依靠价格关键点的突破来入场,并设置了止损保证风险可控。该策略适合震荡行情,可以双向交易获得盈利。但该策略也存在一定的风险,投资者需要谨慎使用,优化的空间在于智能选择参数、结合趋势判断和设计更精细的止损策略等方面。
/*backtest
start: 2023-12-01 00:00:00
end: 2023-12-31 23:59:59
period: 2h
basePeriod: 15m
exchanges: [{"eid":"Futures_Binance","currency":"BTC_USDT"}]
*/

//@version=5
strategy('Monthly Returns with Benchmark', overlay=true, default_qty_type=strategy.percent_of_equity, default_qty_value=25, commission_type=strategy.commission.percent, commission_value=0.1)

////////////
// Inputs //

// Pivot points inputs
leftBars   = input(2, group = "Pivot Points")
rightBars  = input(1, group = "Pivot Points")

// Styling inputs
prec       = input(2, title='Return Precision',                            group = "Monthly Table")
from_date  = input(timestamp("01 Jan 2000 00:00 +0000"), "From Date", group = "Monthly Table")
prof_color = input.color(color.green, title = "Gradient Colors", group = "Monthly Table", inline = "colors")
loss_color = input.color(color.red,   title = "",                group = "Monthly Table", inline = "colors")

// Benchmark inputs
use_cur    = input.bool(true,        title = "Use current Symbol for Benchmark", group = "Benchmark")
symb_bench = input('BTC_USDT:swap', title = "Benchmark",                        group = "Benchmark")
disp_bench = input.bool(true,        title = "Display Benchmark?",               group = "Benchmark")
disp_alpha = input.bool(true,        title = "Display Alpha?",                   group = "Benchmark")

// Pivot Points Strategy
swh = ta.pivothigh(leftBars, rightBars)
swl = ta.pivotlow(leftBars, rightBars)

hprice = 0.0
hprice := not na(swh) ? swh : hprice[1]

lprice = 0.0
lprice := not na(swl) ? swl : lprice[1]

le = false
le := not na(swh) ? true : le[1] and high > hprice ? false : le[1]

se = false
se := not na(swl) ? true : se[1] and low < lprice ? false : se[1]

if le
    strategy.entry('PivRevLE', strategy.long, comment='PivRevLE', stop=hprice + syminfo.mintick)

if se
    strategy.entry('PivRevSE', strategy.short, comment='PivRevSE', stop=lprice - syminfo.mintick)

plot(hprice, color=color.new(color.green, 0), linewidth=2)
plot(lprice, color=color.new(color.red, 0), linewidth=2)

///////////////////
// MONTHLY TABLE //

new_month = month(time) != month(time[1])
new_year  = year(time)  != year(time[1])

eq       = strategy.equity
bench_eq = close

// benchmark eq
bench_eq_htf = request.security(symb_bench, timeframe.period, close)

if (not use_cur)
    bench_eq := bench_eq_htf

bar_pnl   = eq / eq[1] - 1
bench_pnl = bench_eq / bench_eq[1] - 1

cur_month_pnl = 0.0
cur_year_pnl  = 0.0

// Current Monthly P&L
cur_month_pnl := bar_index == 0 ? 0 :
                 time >= from_date and (time[1] < from_date or new_month) ? bar_pnl :
                 (1 + cur_month_pnl[1]) * (1 + bar_pnl) - 1

// Current Yearly P&L
cur_year_pnl  := bar_index == 0 ? 0 :
                 time >= from_date and (time[1] < from_date or new_year) ? bar_pnl :
                 (1 + cur_year_pnl[1]) * (1 + bar_pnl) - 1

bench_cur_month_pnl = 0.0
bench_cur_year_pnl  = 0.0

// Current Monthly P&L - Bench
bench_cur_month_pnl := bar_index == 0 or (time[1] < from_date and time >= from_date) ? 0 :
                       time >= from_date and new_month ? bench_pnl :
                       (1 + bench_cur_month_pnl[1]) * (1 + bench_pnl) - 1

// Current Yearly P&L - Bench
bench_cur_year_pnl :=  bar_index == 0 ? 0 :
                       time >= from_date and (time[1] < from_date  or new_year) ? bench_pnl :
                       (1 + bench_cur_year_pnl[1]) * (1 + bench_pnl) - 1

var month_time = array.new_int(0)
var year_time  = array.new_int(0)

var month_pnl = array.new_float(0)
var year_pnl  = array.new_float(0)

var bench_month_pnl = array.new_float(0)
var bench_year_pnl  = array.new_float(0)

// Filling monthly / yearly pnl arrays
if array.size(month_time) > 0
    if month(time) == month(array.get(month_time, array.size(month_time) - 1))
        array.pop(month_pnl)
        array.pop(bench_month_pnl)
        array.pop(month_time)

if array.size(year_time) > 0
    if year(time) == year(array.get(year_time, array.size(year_time) - 1))
        array.pop(year_pnl)
        array.pop(bench_year_pnl)
        array.pop(year_time)

if (time >= from_date)
    array.push(month_time, time)
    array.push(year_time,  time)

    array.push(month_pnl, cur_month_pnl)
    array.push(year_pnl,  cur_year_pnl)

    array.push(bench_year_pnl,  bench_cur_year_pnl)
    array.push(bench_month_pnl, bench_cur_month_pnl)

// Monthly P&L Table
var monthly_table = table(na)

if array.size(year_pnl) > 0 and barstate.islastconfirmedhistory

    monthly_table := table.new(position.bottom_right, columns=15, rows=array.size(year_pnl) * 3 + 5, border_width=1)

    // Fill monthly performance

    table.cell(monthly_table, 0, 0,  'Perf', bgcolor = #999999)
    table.cell(monthly_table, 1, 0,  'Jan',  bgcolor = #999999)
    table.cell(monthly_table, 2, 0,  'Feb',  bgcolor = #999999)
    table.cell(monthly_table, 3, 0,  'Mar',  bgcolor = #999999)
    table.cell(monthly_table, 4, 0,  'Apr',  bgcolor = #999999)
    table.cell(monthly_table, 5, 0,  'May',  bgcolor = #999999)
    table.cell(monthly_table, 6, 0,  'Jun',  bgcolor = #999999)
    table.cell(monthly_table, 7, 0,  'Jul',  bgcolor = #999999)
    table.cell(monthly_table, 8, 0,  'Aug',  bgcolor = #999999)
    table.cell(monthly_table, 9, 0,  'Sep',  bgcolor = #999999)
    table.cell(monthly_table, 10, 0, 'Oct',  bgcolor = #999999)
    table.cell(monthly_table, 11, 0, 'Nov',  bgcolor = #999999)
    table.cell(monthly_table, 12, 0, 'Dec',  bgcolor = #999999)
    table.cell(monthly_table, 13, 0, ' ', bgcolor = #999999)
    table.cell(monthly_table, 14, 0, 'Year', bgcolor = #999999)

    max_abs_y = math.max(math.abs(array.max(year_pnl)),  math.abs(array.min(year_pnl)))
    max_abs_m = math.max(math.abs(array.max(month_pnl)), math.abs(array.min(month_pnl)))

    for yi = 0 to array.size(year_pnl) - 1 by 1
        table.cell(monthly_table, 0,  yi + 1, str.tostring(year(array.get(year_time, yi))), bgcolor=#cccccc)
        table.cell(monthly_table, 13, yi + 1, ' ',   bgcolor=#999999)
        y_color = color.from_gradient(array.get(year_pnl, yi), -max_abs_y, max_abs_y, loss_color, prof_color)
        table.cell(monthly_table, 14, yi + 1, str.tostring(math.round(array.get(year_pnl, yi) * 100, prec)), bgcolor=y_color)

    for mi = 0 to array.size(month_time) - 1 by 1
        m_row = year(array.get(month_time, mi)) - year(array.get(year_time, 0)) + 1
        m_col = month(array.get(month_time, mi))
        m_color = color.from_gradient(array.get(month_pnl, mi), -max_abs_m, max_abs_m, loss_color, prof_color)

        table.cell(monthly_table, m_col, m_row, str.tostring(math.round(array.get(month_pnl, mi) * 100, prec)), bgcolor=m_color)

    // Fill benchmark performance
    next_row =  array.size(year_pnl) + 1

    if (disp_bench)

        table.cell(monthly_table, 0,  next_row, 'Bench', bgcolor=#999999)
        table.cell(monthly_table, 1,  next_row, 'Jan',   bgcolor=#999999)
        table.cell(monthly_table, 2,  next_row, 'Feb',   bgcolor=#999999)
        table.cell(monthly_table, 3,  next_row, 'Mar',   bgcolor=#999999)
        table.cell(monthly_table, 4,  next_row, 'Apr',   bgcolor=#999999)
        table.cell(monthly_table, 5,  next_row, 'May',   bgcolor=#999999)
        table.cell(monthly_table, 6,  next_row, 'Jun',   bgcolor=#999999)
        table.cell(monthly_table, 7,  next_row, 'Jul',   bgcolor=#999999)
        table.cell(monthly_table, 8,  next_row, 'Aug',   bgcolor=#999999)
        table.cell(monthly_table, 9,  next_row, 'Sep',   bgcolor=#999999)
        table.cell(monthly_table, 10, next_row, 'Oct',   bgcolor=#999999)
        table.cell(monthly_table, 11, next_row, 'Nov',   bgcolor=#999999)
        table.cell(monthly_table, 12, next_row, 'Dec',   bgcolor=#999999)
        table.cell(monthly_table, 13, next_row, ' ',     bgcolor = #999999)
        table.cell(monthly_table, 14, next_row, 'Year',  bgcolor=#999999)

        max_bench_abs_y = math.max(math.abs(array.max(bench_year_pnl)),  math.abs(array.min(bench_year_pnl)))
        max_bench_abs_m = math.max(math.abs(array.max(bench_month_pnl)), math.abs(array.min(bench_month_pnl)))

        for yi = 0 to array.size(year_time) - 1 by 1
            table.cell(monthly_table, 0,  yi + 1 + next_row + 1, str.tostring(year(array.get(year_time, yi))), bgcolor=#cccccc)
            table.cell(monthly_table, 13, yi + 1 + next_row + 1, ' ',   bgcolor=#999999)
            y_color = color.from_gradient(array.get(bench_year_pnl, yi), -max_bench_abs_y, max_bench_abs_y, loss_color, prof_color)
            table.cell(monthly_table, 14, yi + 1 + next_row + 1, str.tostring(math.round(array.get(bench_year_pnl, yi) * 100, prec)), bgcolor=y_color)

        for mi = 0 to array.size(month_time) - 1 by 1
            m_row = year(array.get(month_time, mi)) - year(array.get(year_time, 0)) + 1
            m_col = month(array.get(month_time, mi))
            m_color = color.from_gradient(array.get(bench_month_pnl, mi), -max_bench_abs_m, max_bench_abs_m, loss_color, prof_color)

            table.cell(monthly_table, m_col, m_row  + next_row + 1, str.tostring(math.round(array.get(bench_month_pnl, mi) * 100, prec)), bgcolor=m_color)

    // Fill Alpha
    if (disp_alpha)

        next_row :=  array.size(year_pnl) * 2 + 3
        table.cell(monthly_table, 0,  next_row, 'Alpha', bgcolor=#999999)
        table.cell(monthly_table, 1,  next_row, 'Jan',   bgcolor=#999999)
        table.cell(monthly_table, 2,  next_row, 'Feb',   bgcolor=#999999)
        table.cell(monthly_table, 3,  next_row, 'Mar',   bgcolor=#999999)
        table.cell(monthly_table, 4,  next_row, 'Apr',   bgcolor=#999999)
        table.cell(monthly_table, 5,  next_row, 'May',   bgcolor=#999999)
        table.cell(monthly_table, 6,  next_row, 'Jun',   bgcolor=#999999)
        table.cell(monthly_table, 7,  next_row, 'Jul',   bgcolor=#999999)
        table.cell(monthly_table, 8,  next_row, 'Aug',   bgcolor=#999999)
        table.cell(monthly_table, 9,  next_row, 'Sep',   bgcolor=#999999)
        table.cell(monthly_table, 10, next_row, 'Oct',   bgcolor=#999999)
        table.cell(monthly_table, 11, next_row, 'Nov',   bgcolor=#999999)
        table.cell(monthly_table, 12, next_row, 'Dec',   bgcolor=#999999)
        table.cell(monthly_table, 13, next_row, '',      bgcolor=#999999)
        table.cell(monthly_table, 14, next_row, 'Year',  bgcolor=#999999)

        max_alpha_abs_y = 0.0
        for yi = 0 to array.size(year_time) - 1 by 1
            if (math.abs(array.get(year_pnl, yi)  - array.get(bench_year_pnl, yi)) > max_alpha_abs_y)
                max_alpha_abs_y := math.abs(array.get(year_pnl, yi)  - array.get(bench_year_pnl, yi))

        max_alpha_abs_m = 0.0
        for mi = 0 to array.size(month_pnl) - 1 by 1
            if (math.abs(array.get(month_pnl, mi) - array.get(bench_month_pnl, mi)) > max_alpha_abs_m)
                max_alpha_abs_m := math.abs(array.get(month_pnl, mi) - array.get(bench_month_pnl, mi))

        for yi = 0 to array.size(year_time) - 1 by 1
            table.cell(monthly_table, 0,  yi + 1 + next_row + 1, str.tostring(year(array.get(year_time, yi))), bgcolor=#cccccc)
            table.cell(monthly_table, 13, yi + 1 + next_row + 1, ' ',   bgcolor=#999999)
            y_color = color.from_gradient(array.get(year_pnl, yi)  - array.get(bench_year_pnl, yi), -max_alpha_abs_y, max_alpha_abs_y, loss_color, prof_color)
            table.cell(monthly_table, 14, yi + 1 + next_row + 1, str.tostring(math.round((array.get(year_pnl, yi)  - array.get(bench_year_pnl, yi)) * 100, prec)), bgcolor=y_color)

        for mi = 0 to array.size(month_time) - 1 by 1
            m_row = year(array.get(month_time, mi)) - year(array.get(year_time, 0)) + 1
            m_col = month(array.get(month_time, mi))
            m_color = color.from_gradient(array.get(month_pnl, mi) - array.get(bench_month_pnl, mi), -max_alpha_abs_m, max_alpha_abs_m, loss_color, prof_color)

            table.cell(monthly_table, m_col, m_row  + next_row + 1, str.tostring(math.round((array.get(month_pnl, mi) - array.get(bench_month_pnl, mi)) * 100, prec)), bgcolor=m_color)