概述
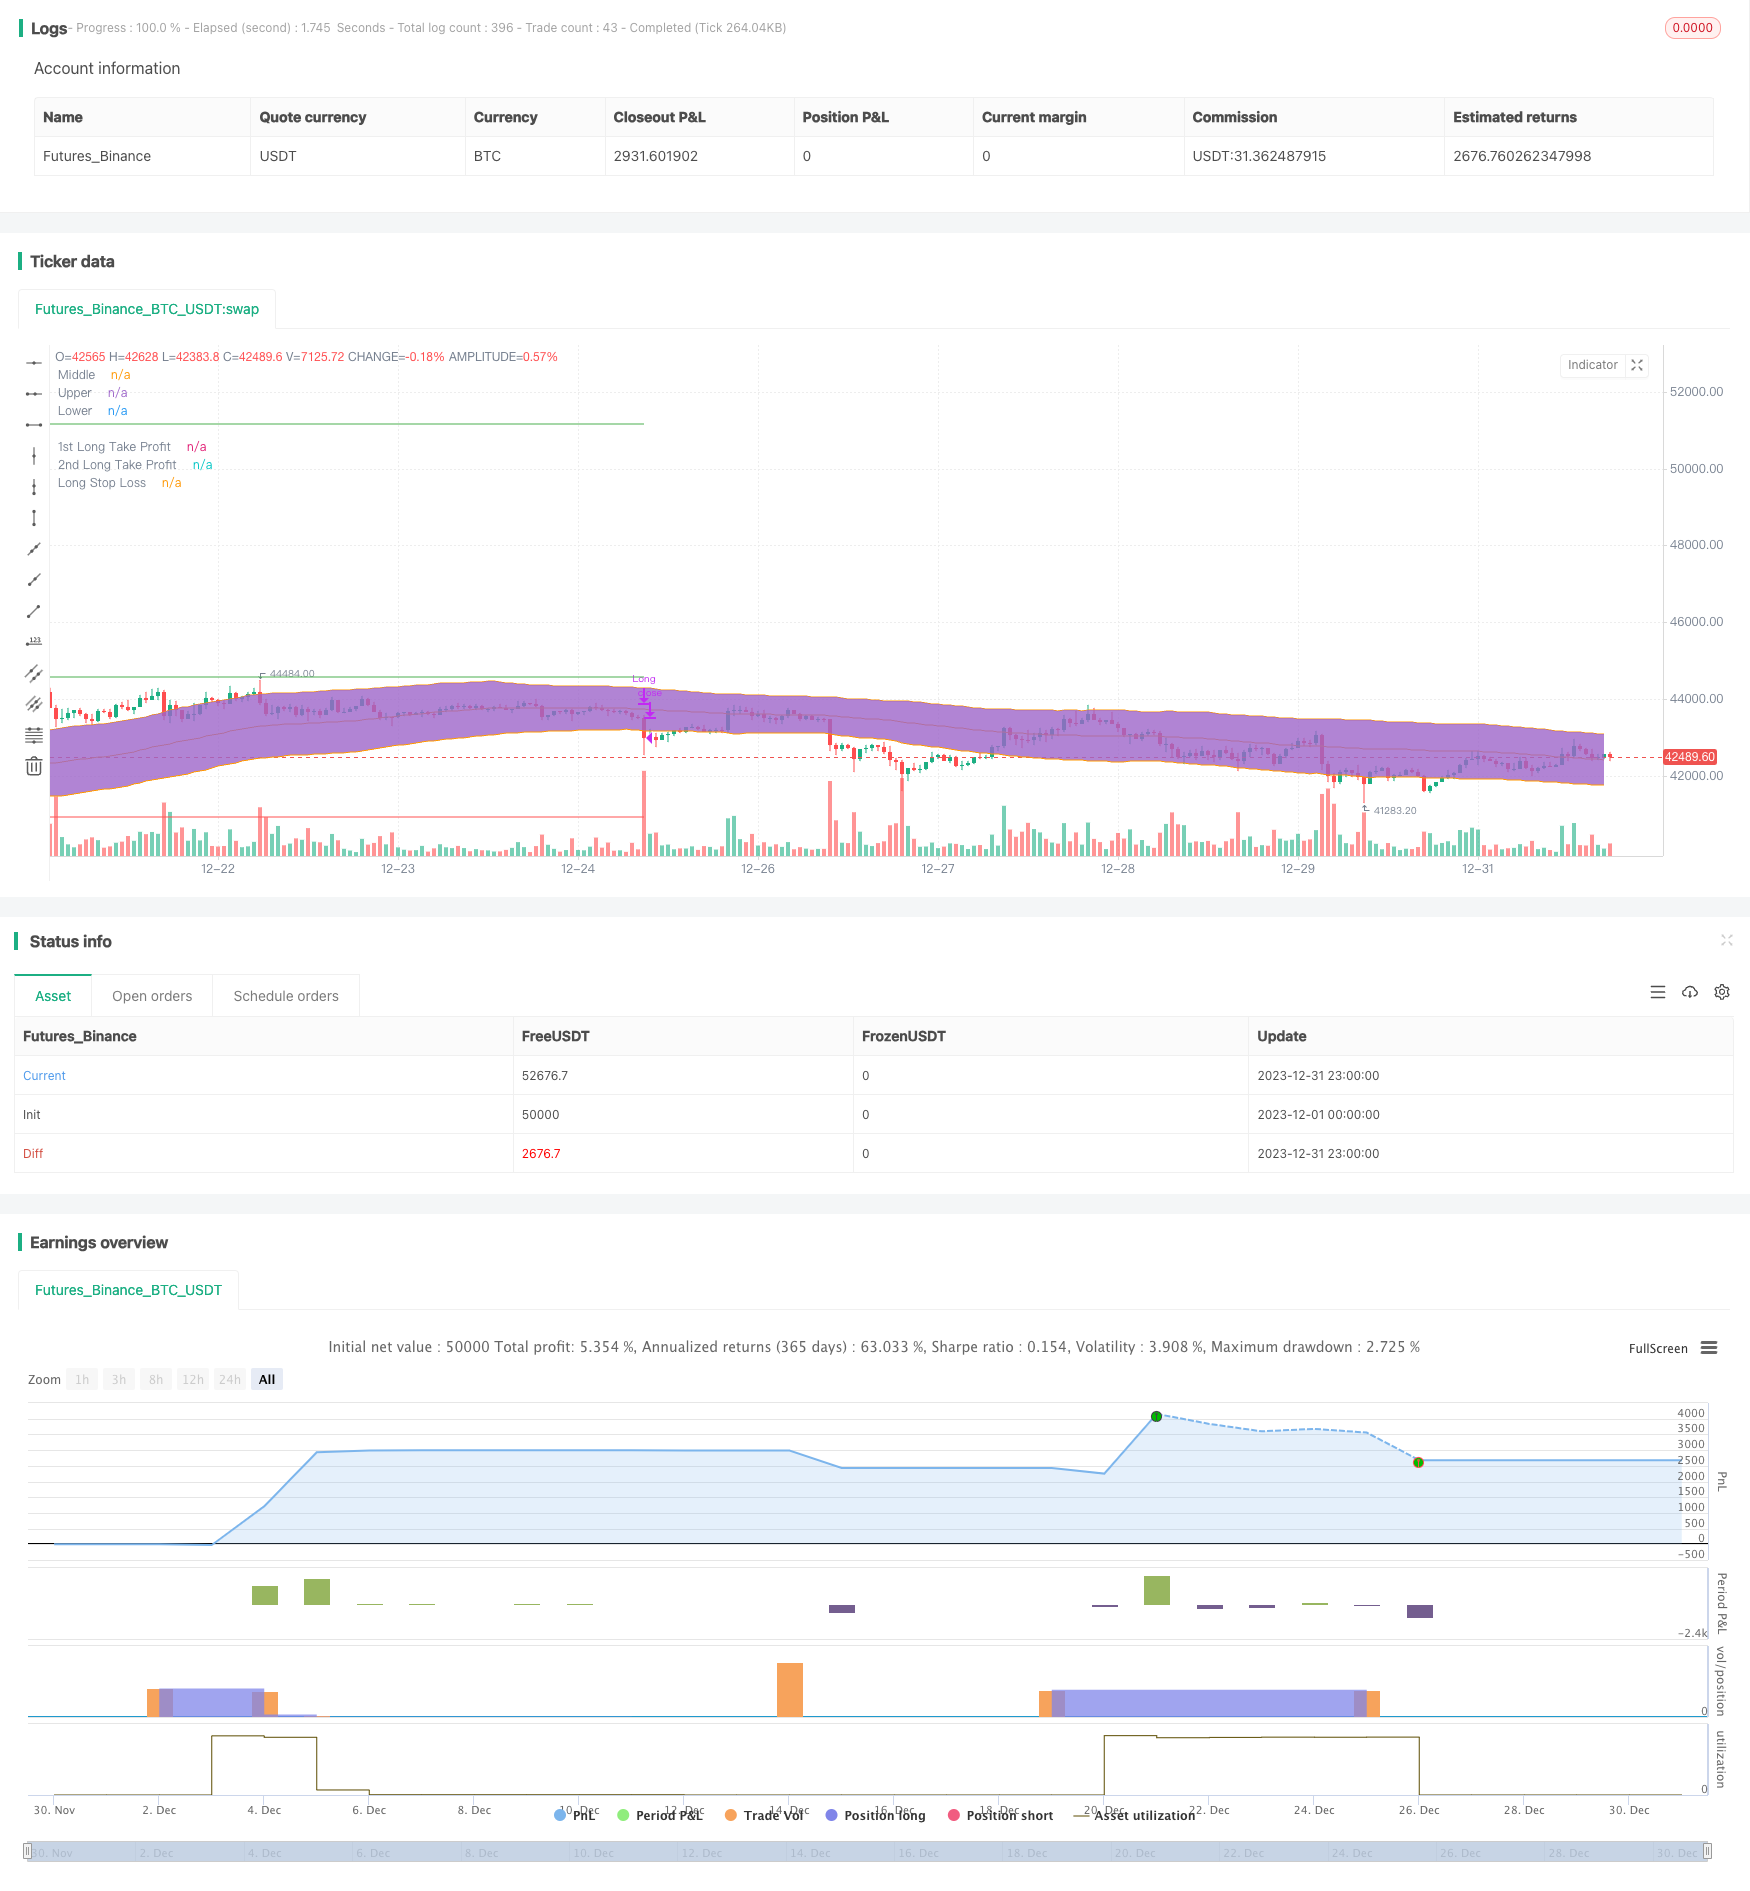
双边突破K线波动通道策略通过计算通道中轨、上轨和下轨,结合趋向指标和量价指标判断行情方向和力度,在通道两边同时设置突破信号,实现低买高卖的主要目的。
策略原理
该策略的核心指标是基于统计学的K线波动通道。通道中轨采用平均线算法,上下轨采用平均真实波幅的计算方法,能动态捕捉价格波动的边界。与此同时,策略加入DMI和交易量的判断规则,避免虚假突破带来损失。
具体来说,当价格从下轨突破进入通道,DMI的+DI线超过-DI线和设定的ADX基准线,且成交量放大时产生买入信号。反之,价格从上轨往下突破通道时,判断规则与上述相反,产生卖出信号。
优势分析
该策略最大的优势是捕捉价格的主要突破方向,采用双边突破判断可以有效避开盘整和震荡的行情,减小止损次数。与简单移动平均线策略相比,K线通道突破判断对价格波动的适应性更强。
此外,辅助指标DMI和成交量的引入也起到良好的过滤作用,避免出现虚假信号。所以从胜率和盈亏比角度来看,该策略都有一定的优势。
风险分析
双边突破策略最大的风险在于无法判断行情反转,如果行情出现V型反转,止损点有可能会被轻易触发。此外,参数设置不当也会对交易系统产生负面影响。
针对风险,我们可以通过进一步优化指标参数,缩小止损幅度来降低风险。当然,交易系统永远不可能完全避免亏损,关键是要控制风险。
优化方向
该策略还具有很强的优化潜力,主要可以从以下几个方面进行改进:
优化参数,如DMI的DI和ADX长度、K线通道的周期和倍数设置等参数细调
增加过滤条件,如结合MACD等其他指标避免虚假突破
实现止盈止损自动跟踪,从而进一步控制风险
针对不同品种参数设置和过滤规则进行优化
总结
双边突破K线波动通道策略总的来说是一种行之有效的突破系统。它能有效判断主要趋势方向和力度,在优化和风险控制方面也有很大的潜力。如果系统性地进行改进与优化,该策略可以长期稳定盈利。
/*backtest
start: 2023-12-01 00:00:00
end: 2023-12-31 23:59:59
period: 1h
basePeriod: 15m
exchanges: [{"eid":"Futures_Binance","currency":"BTC_USDT"}]
*/

//Original Idea by: Wunderbit Trading

//@version=5
strategy('Keltner Channel ETH/USDT 1H', overlay=true, initial_capital=1000, pyramiding=0, currency='USD', default_qty_type=strategy.percent_of_equity, default_qty_value=100, commission_type=strategy.commission.percent, commission_value=0.07)


/// TREND
ribbon_period = input.int(46, 'Period', step=1)

leadLine1 = ta.ema(close, ribbon_period)
leadLine2 = ta.sma(close, ribbon_period)

// p3 = plot(leadLine1, color= #53b987, title="EMA", transp = 50, linewidth = 1)
// p4 = plot(leadLine2, color= #eb4d5c, title="SMA", transp = 50, linewidth = 1)
// fill(p3, p4, transp = 60, color = leadLine1 > leadLine2 ? #53b987 : #eb4d5c)

//Upward Trend
UT = leadLine2 < leadLine1
DT = leadLine2 > leadLine1

///////////////////////////////////////INDICATORS

// KELTNER //
source = close
useTrueRange = input(true)
length = input.int(81, step=1, minval=1)
mult = input.float(2.5, step=0.1)

// Calculate Keltner Channel
ma = ta.sma(source, length)
range_1 = useTrueRange ? ta.tr : high - low
rangema = ta.sma(range_1, length)
upper = ma + rangema * mult
lower = ma - rangema * mult

plot(ma, title='Middle', color=color.new(color.orange, 0))
p1 = plot(upper, title='Upper', color=color.new(color.orange, 0))
p2 = plot(lower, title='Lower', color=color.new(color.orange, 0))
fill(p1, p2, transp=90)


// DMI INDICATOR //
adxlen = 10  // input(10, title="ADX Smoothing")
dilen = input(19, title='DI Length')
keyLevel = 23  // input(23, title="key level for ADX")
dirmov(len) =>
    up = ta.change(high)
    down = -ta.change(low)
    truerange = ta.rma(ta.tr, len)
    plus = fixnan(100 * ta.rma(up > down and up > 0 ? up : 0, len) / truerange)
    minus = fixnan(100 * ta.rma(down > up and down > 0 ? down : 0, len) / truerange)
    [plus, minus]

adx(dilen, adxlen) =>
    [plus, minus] = dirmov(dilen)
    sum = plus + minus
    adx = 100 * ta.rma(math.abs(plus - minus) / (sum == 0 ? 1 : sum), adxlen)
    [adx, plus, minus]

[sig, up, down] = adx(dilen, adxlen)

benchmark = input.int(title='DMI Benchmark', defval=27, minval=1, step=1)

// plot(sig, color=color.red, title="ADX")
// plot(up, style=plot.style_histogram, color=color.green, title="+DI")
// plot(down, style=plot.style_histogram, color=color.red, title="-DI")
// plot(keyLevel, color=color.white, title="Key Level")

///////////////////////////////////////////////////////////


////////////////////////////////////////////////////Component Code Start

testStartYear = input(2019, 'Backtest Start Year')
testStartMonth = input(1, 'Backtest Start Month')
testStartDay = input(1, 'Backtest Start Day')
testPeriodStart = timestamp(testStartYear, testStartMonth, testStartDay, 0, 0)

testStopYear = input(9999, 'Backtest Stop Year')
testStopMonth = input(12, 'Backtest Stop Month')
testStopDay = input(31, 'Backtest Stop Day')
testPeriodStop = timestamp(testStopYear, testStopMonth, testStopDay, 0, 0)

testPeriod() => true
///// Component Code Stop //////////////////////////////////////////

//////////////// STRATEGY EXECUTION //////////////////////////

//LONG SET UP
// Take Profit / Stop Loss
long_tp1_inp = input.float(4.5, title='Long Take Profit 1 %', step=0.1) / 100
long_tp1_qty = input.int(15, title='Long Take Profit 1 Qty', step=1)

long_tp2_inp = input.float(20, title='Long Take Profit 2%', step=0.1) / 100
long_tp2_qty = input.int(100, title='Long Take Profit 2 Qty', step=1)

long_take_level_1 = strategy.position_avg_price * (1 + long_tp1_inp)
long_take_level_2 = strategy.position_avg_price * (1 + long_tp2_inp)

long_sl_inp = input.float(4, title='Long Stop Loss %', step=0.1) / 100
long_stop_level = strategy.position_avg_price * (1 - long_sl_inp)


// STRATEGY CONDITION
// LONG
entry_long = open > lower and open < upper and close > upper and up > down and up > benchmark  //  and volume[0] > volume[1]
entry_price_long = ta.valuewhen(entry_long, close, 0)
SL_long = entry_price_long * (1 - long_sl_inp)
exit_long = close < lower or low < SL_long


// STRATEGY EXECUTION
if testPeriod()

    // LONG
    if UT
        strategy.entry(id='Long', direction=strategy.long, when=entry_long, comment='INSERT ENTER LONG COMMAND')
    strategy.exit('TP1', 'Long', qty_percent=long_tp1_qty, limit=long_take_level_1)  // PLACE TAKE PROFIT IN WBT BOT SETTINGS
    strategy.exit('TP2', 'Long', qty_percent=long_tp2_qty, limit=long_take_level_2)  // PLACE TAKE PROFIT IN WBT BOT SETTINGS
    strategy.close(id='Long', when=exit_long, comment='INSERT EXIT LONG COMMAND')


//PLOT FIXED SLTP LINE
// LONG POSITION
plot(strategy.position_size > 0 ? long_take_level_1 : na, style=plot.style_linebr, color=color.new(color.green, 0), linewidth=1, title='1st Long Take Profit')
plot(strategy.position_size > 0 ? long_take_level_2 : na, style=plot.style_linebr, color=color.new(color.green, 0), linewidth=1, title='2nd Long Take Profit')
plot(strategy.position_size > 0 ? long_stop_level : na, style=plot.style_linebr, color=color.new(color.red, 0), linewidth=1, title='Long Stop Loss')