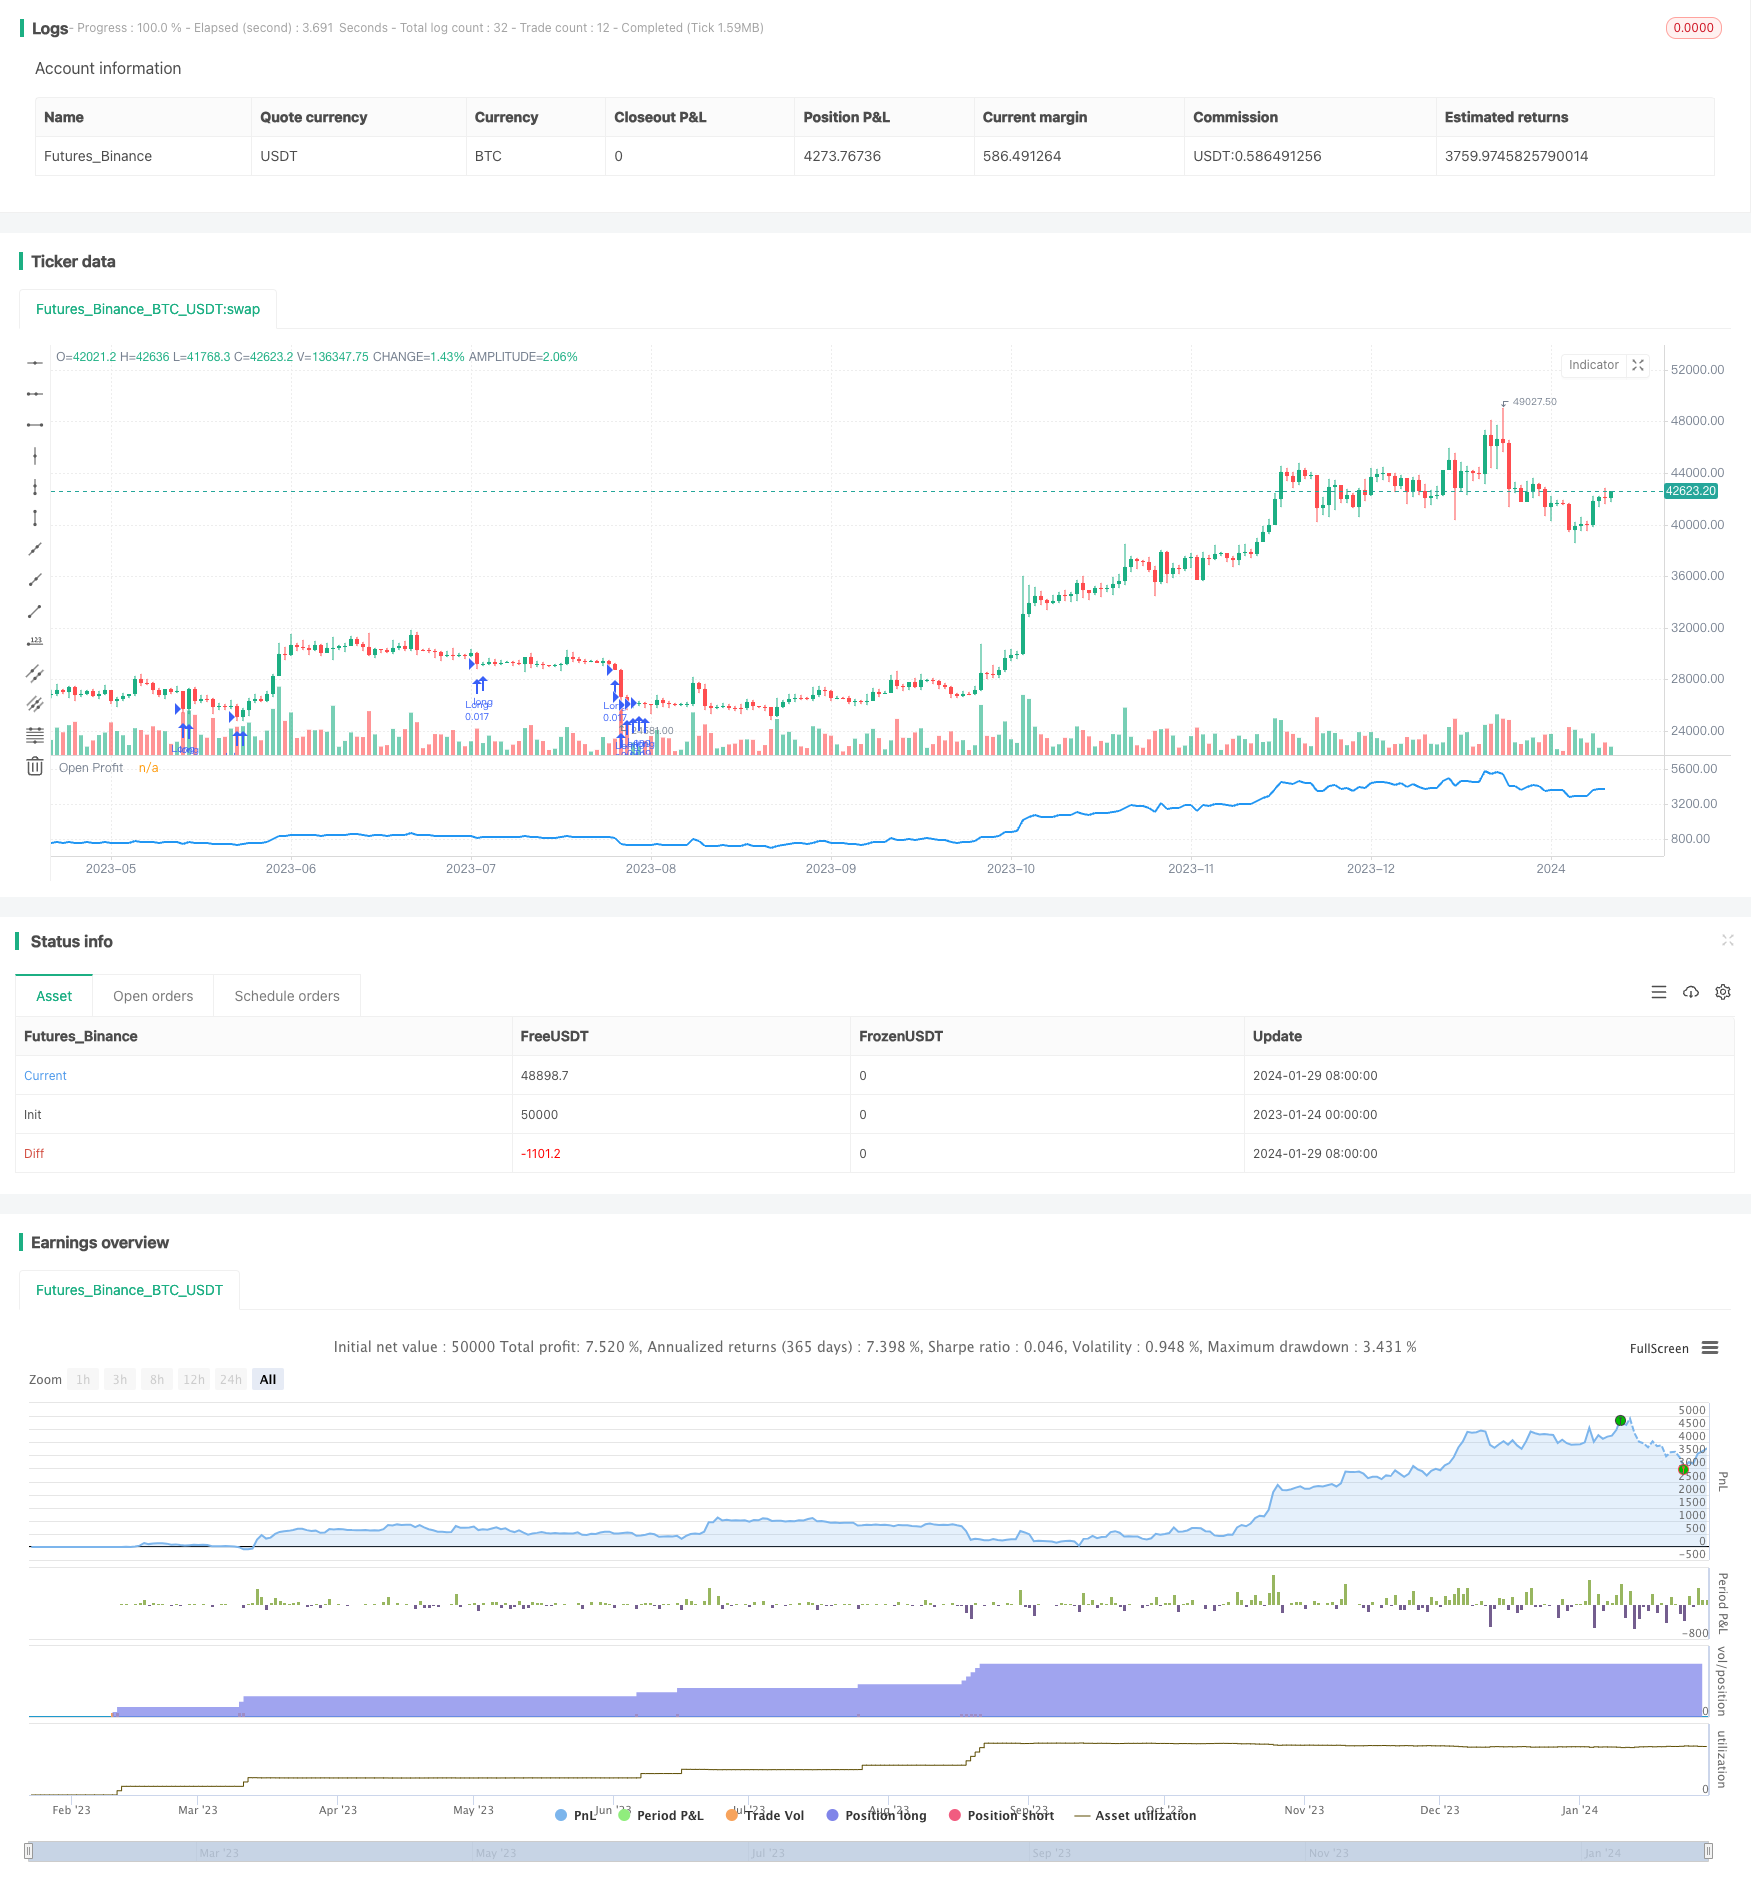
Momentum Bollinger Bands Dual Moving Average DCA Strategy

Author: ChaoZhang, Date: 2024-01-31 14:20:11
Tags:

img

Overview

The Momentum Bollinger Bands Dual Moving Average DCA strategy is a low-risk, long-term holding dollar-cost averaging strategy. It uses the Bollinger Bands indicator to determine if the price has broken below the lower rail and the RSI indicator to determine if it is in the oversold area, combined with the dual moving average to judge the market trend. It buys in fixed amounts such as $500 when the price breaks below the Bollinger Bands lower rail and the RSI is below 50.

Strategy Logic

This strategy is mainly based on the Bollinger Bands and RSI indicators, supplemented by dual moving averages to determine market trends. Bollinger Bands are calculated based on normal distribution statistical theory to construct the price range of stocks. When the price breaks below the lower rail, it indicates that the stock has entered a relatively low price area. The RSI indicator determines whether the price is in the oversold area. The dual moving averages determine the short-term and medium-term market trends.

The trading logic of this strategy is: when the stock price breaks below the Bollinger Bands lower rail and the RSI is below 50, fixed amount is invested to buy in, indicating that the stock is at a relatively low level and has some rebound momentum. The dual moving average judges the market trend and avoids continued buying during persistent market declines.

Advantage Analysis

The biggest advantage of this strategy is that it has relatively low risks and is easy to operate. By adopting a fixed investment strategy, there is no need to pay attention to specific entry timing. As long as the conditions are met, buying occurs, reducing trading frequency. The Bollinger Bands indicator determines that a break below the lower rail represents entering the low price area where the upside potential is greater after buying in. An RSI below 50 determines that it has entered the oversold zone and is likely to rebound. The fixed amount investment also controls the extent of a single loss.

Risk Analysis

The main risks of this strategy are: 1) Unable to determine the market bottom, there is still a risk of losses when the stock market plummets; 2) The RSI indicator does not always determine the end of the oversold area, and prices may continue to decline. 3) Fixed investment strategies require regular capital investment, which will also affect performance if it cannot be sustained. 4) Transaction costs will have some impact on frequent small transactions.

To control risks, relatively low-risk assets like index ETFs can be traded. Avoid buying too frequently when the overall market is in a downward channel. Consider adjusting RSI parameters to identify ending points of oversold zones.

Optimization

This strategy can be optimized in the following aspects:

  1. Use more indicators to determine entry timing. Such as adding MACD, KD and other indicators to determine if it is in the oversold area.

  2. Add stop loss strategy. Stop loss when price continues to decline by a certain percentage to avoid excessive losses.

  3. Adjust Bollinger Bands parameters. When market volatility increases, appropriately expand the Bollinger Bands channel to avoid excessive buying.

  4. Incorporate trading volume indicators, such as the Chaikin Money Flow indicator, to avoid buys in low volume areas.

  5. Adopt algorithm to automatically optimize RSI parameters, so that RSI parameters are updated in real time to better determine the end of the oversold area.

Conclusion

The Momentum Bollinger Bands Dual Moving Average DCA Strategy integrates Bollinger Bands to determine relatively low price levels, RSI to determine oversold areas, and dual moving averages to determine market trends, implementing a low-risk fixed investment buying strategy. Compared to other fixed investment strategies, this strategy pays more attention to the selection of entry timing. Although it is impossible to completely avoid losses, the extent of losses is limited, and long-term holding gains are relatively considerable. By adjusting some parameters and optimizing indicators, trading risks can be further reduced and strategy efficiency improved.


/*backtest
start: 2023-01-24 00:00:00
end: 2024-01-30 00:00:00
period: 1d
basePeriod: 1h
exchanges: [{"eid":"Futures_Binance","currency":"BTC_USDT"}]
*/

//@version=4
strategy("Bollinger DCA v1", overlay=false)

//user inputs
contribution = input(title="Contribution (USD)",type=input.integer,minval=1,maxval=1000000,step=1,defval=500,confirm=false)
length = input(title="Bollinger (Period)", defval=20, step=1, minval=1)
mult = input(title="Deviations (Float)", defval=2.0, step=0.001, minval=0.001, maxval=50)
rsi_period = input(title="RSI (Period)", defval=14, step=1, minval=1)

//compute bollinger bands
source = close
basis = sma(source, length)
dev = mult * stdev(source, length)
upper = basis + dev
lower = basis - dev

//compute moving averages
ma50 = sma(close,50)
ma100 = sma(close,100)
ma150 = sma(close,150)
ma200 = sma(close,200)
//up_trend = ma50 > ma100 and ma100 > ma150 and ma150 > ma200
//dn_trend = ma50 < ma100 and ma100 < ma150 and ma150 < ma200

//compute rsi
strength = rsi(close, rsi_period)

//plot indicators
//p1 = plot(upper, color=color.gray)
//p2 = plot(lower, color=color.gray)
//fill(p1, p2)
//p3 = plot(ma50, color=color.red)
//p4 = plot(ma100, color=color.blue)
//p5 = plot(ma150, color=color.green)
//p6 = plot(ma200, color=color.orange)

//units to buy
units = contribution / close

//long signal
if (close < lower and strength < 50)
    strategy.order("Long", strategy.long, units)

//close long signal
//if (close > upper and strength > 50 and strategy.position_size > 0)
    //strategy.order("Close Long", strategy.short, units)
    
//plot strategy equity
plot(strategy.openprofit, color=color.blue, linewidth=2, title="Open Profit")

More