概述
本策略综合利用双移动平均线交叉技术与压力位突破技术,设定买入信号与卖出信号,实现自动交易。当短期均线从下向上突破中期均线,并且股价突破压力位时产生买入信号;当股价上涨15%时设置止盈,下跌3%时设置止损。该策略可自动识别市场趋势,在技术指标信号出现时自动入场,并设置止盈止损来控制风险,属于较为成熟的量化交易策略。
策略原理
本策略主要基于以下几个技术指标与条件判断来产生交易信号:
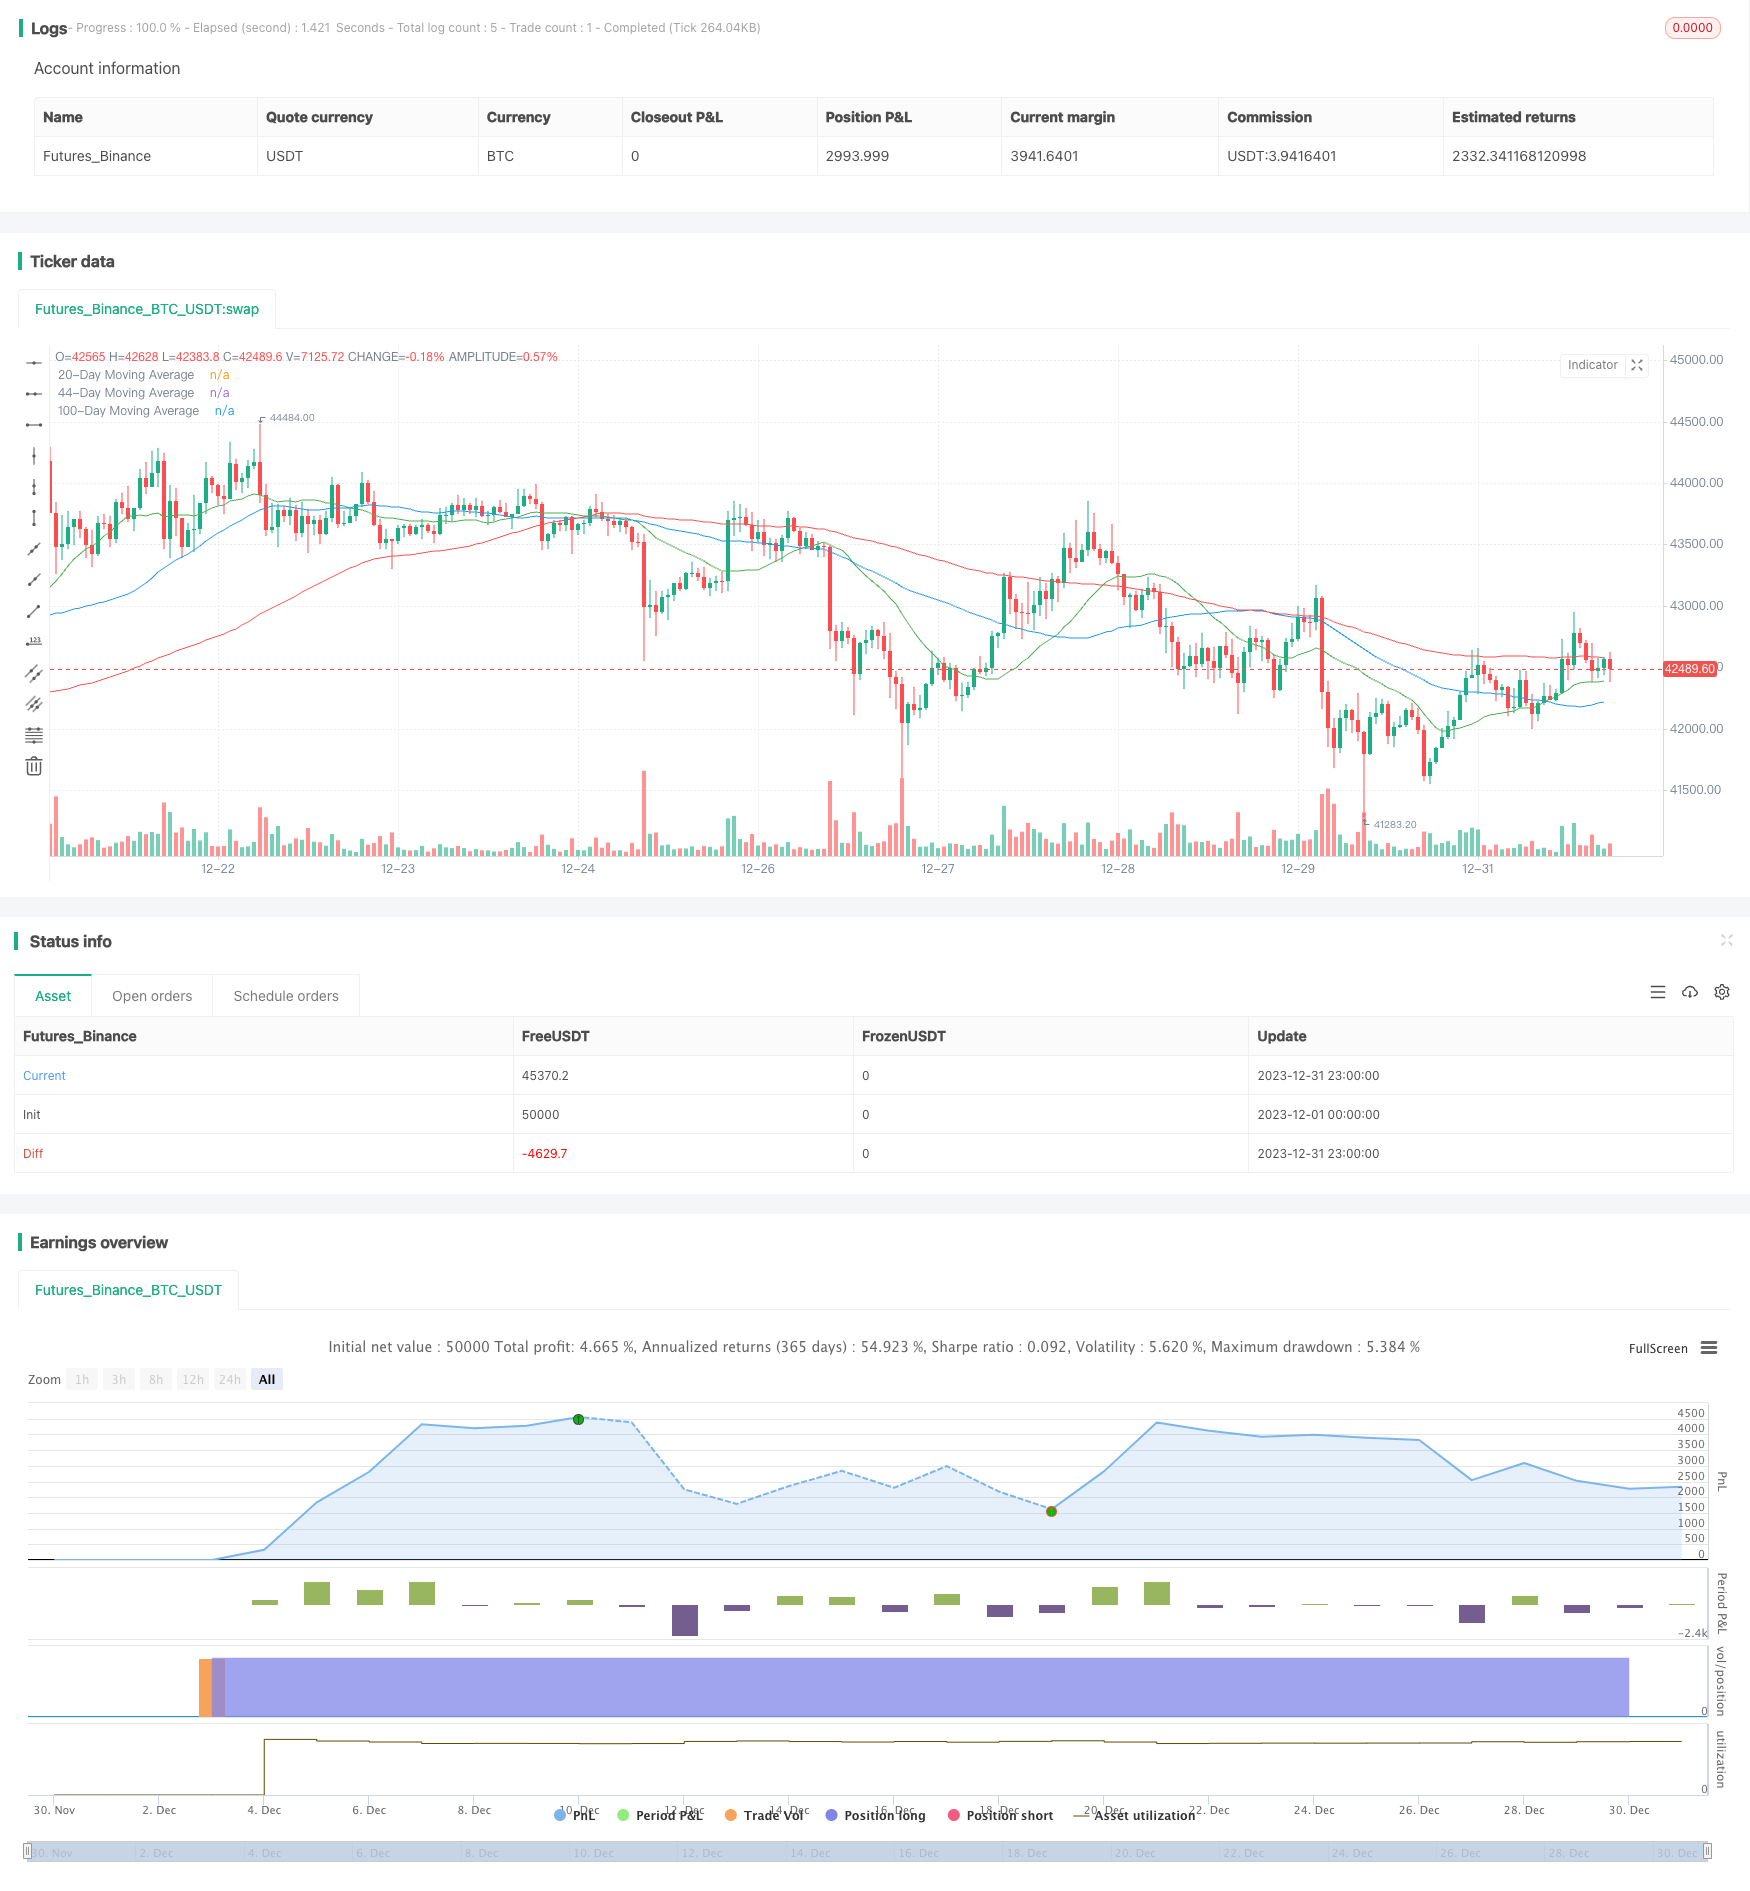
双均线交叉技术:计算20日、44日简单移动平均线,当20日均线上穿44日均线时判断为市场处于上升趋势,产生买入信号。
压力位突破技术:图表显示股价曾多次接近但未能突破的位置被称为压力位。当股价成功突破压力位后,预示着价格进入新的上升阶段。本策略判断股价突破前一交易日最高价的0.7%范围则可视为突破压力位。
超买超卖指标RSI:相对强弱指数,判断市场是超买还是超卖的技术指标。本策略设定14日RSI指标大于50时为超买信号。
成交量分析:成交量突破过去10日平均成交量预示着市场出现更加强劲的买盘或卖盘。
买入信号:短期均线上穿中期均线且股价突破压力位,市场为超买状态,且成交量高于过去10日平均成交量,则产生买入信号。
卖出信号:设置止盈止损标准,若股价较买入价格上涨15%则止盈;若下跌3%则止损。
该策略综合运用多种技术指标判断市场结构,并在其指示趋势出现时自动产生交易信号,属于较为成熟完整的量化交易策略。
策略优势
利用均线技术判断市场结构,能稳定捕捉市场趋势;
结合成交量分析,避免在成交量不匹配的假突破中打开仓位;
设置止盈止损退出机制,可以很好控制单笔交易的风险收益比,避免亏损扩大;
总体来说,该策略对市场结构判断准确,交易规则严谨,风险控制到位,是一个效果较好的量化策略。
策略风险
双均线交易系统对参数设置较为敏感,不同时段参数需要调整;
纯粹追踪趋势的策略,无法对突发事件作出反应,如重大利空消息面前难免遭遇止损;
虽然设置了止盈止损,但交易次数较多时止损次数亦不可避免较多,存在获利水平参差不齐的风险。
从长期看,技术指标发出信号的时点往往已经略过市场反转的最佳点位。
策略优化方向
可采用参数优化方法寻找最佳双均线参数组合,优化止盈止损水平;
增加其他指标判断,如布林带判明盘整范围、MACD判明超买超卖等,提升发出信号时点;
增加基本面或消息面判断,避免重大负面消息造成止损;
优化资金管理策略,如固定数量交易、固定资金比例交易等,控制单笔风险。
总结
本策略整体运作顺畅,判断准确且交易规则严谨,风险控制到位,属于效果较好的量化策略之一。但技术面交易策略对市场结构的判断仍有局限,优化空间在于增加其他指标判断和基本面消息面的综合考量,此外进一步优化止盈止损设定及资金管理策略亦为重点。总体而言,本策略作为技术指标策略已经达到较高水平,但下一步仍需要朝基本面 Messages 驱动全市场周期策略的方向继续优化。
/*backtest
start: 2023-12-01 00:00:00
end: 2023-12-31 23:59:59
period: 1h
basePeriod: 15m
exchanges: [{"eid":"Futures_Binance","currency":"BTC_USDT"}]
*/

//@version=5
strategy("Advanced Strategy with Conditional Stop Loss", overlay=true)

// Parameters
ma_length_20 = 20
ma_length_44 = 44
ma_length_100 = 100
rsi_length = 14
volume_length = 10
profit_target = 1.15 // 15% above the buy price
stop_loss_target = 0.97 // 3% below the buy price
wait_candles = 10 // Number of candles to wait after selling, unless MA cross condition met

// Indicators
moving_average_20 = ta.sma(close, ma_length_20)
moving_average_44 = ta.sma(close, ma_length_44)
moving_average_100 = ta.sma(close, ma_length_100)
rsi = ta.rsi(close, rsi_length)
volumeAvg = ta.sma(volume, volume_length)

// Variables to manage the wait period after a sell
var int last_sell_candle = 0

// Update last sell candle
if (strategy.position_size[1] > 0 and strategy.position_size == 0)
    last_sell_candle := bar_index

// Trend identification
uptrend = close > moving_average_20
above_ma20_by_1_percent = close > moving_average_20 * 1.01
ma_cross = ta.crossover(moving_average_20, moving_average_44) or ta.crossunder(moving_average_20, moving_average_44)
close_near_high = (close >= high * 0.993) and (close <= high)

// Buy condition (only in uptrend, above 1% from 20-day MA, and respecting new filter)
can_buy_after_cross = ma_cross and close > high[1]
can_buy_after_wait = (bar_index - last_sell_candle) > wait_candles
buy_condition = (can_buy_after_cross or can_buy_after_wait) and uptrend and above_ma20_by_1_percent and close > moving_average_44 and close > moving_average_100 and close > high[1] and rsi > 50 and volume > volumeAvg and not close_near_high

// Entry
if (buy_condition and strategy.position_size == 0)
    strategy.entry("Buy", strategy.long)

// Exit conditions
if (strategy.position_size > 0)
    // Profit target
    profit_level = strategy.position_avg_price * profit_target
    strategy.exit("Take Profit", "Buy", limit=profit_level)

    // Dynamic Stop Loss - Check on every bar if the price has dropped 3% below the buy price
    stop_loss_level = strategy.position_avg_price * stop_loss_target
    if (low < stop_loss_level)
        strategy.close("Buy", comment="Stop Loss")

// Plotting
plot(moving_average_20, color=color.green, title="20-Day Moving Average")
plot(moving_average_44, color=color.blue, title="44-Day Moving Average")
plot(moving_average_100, color=color.red, title="100-Day Moving Average")