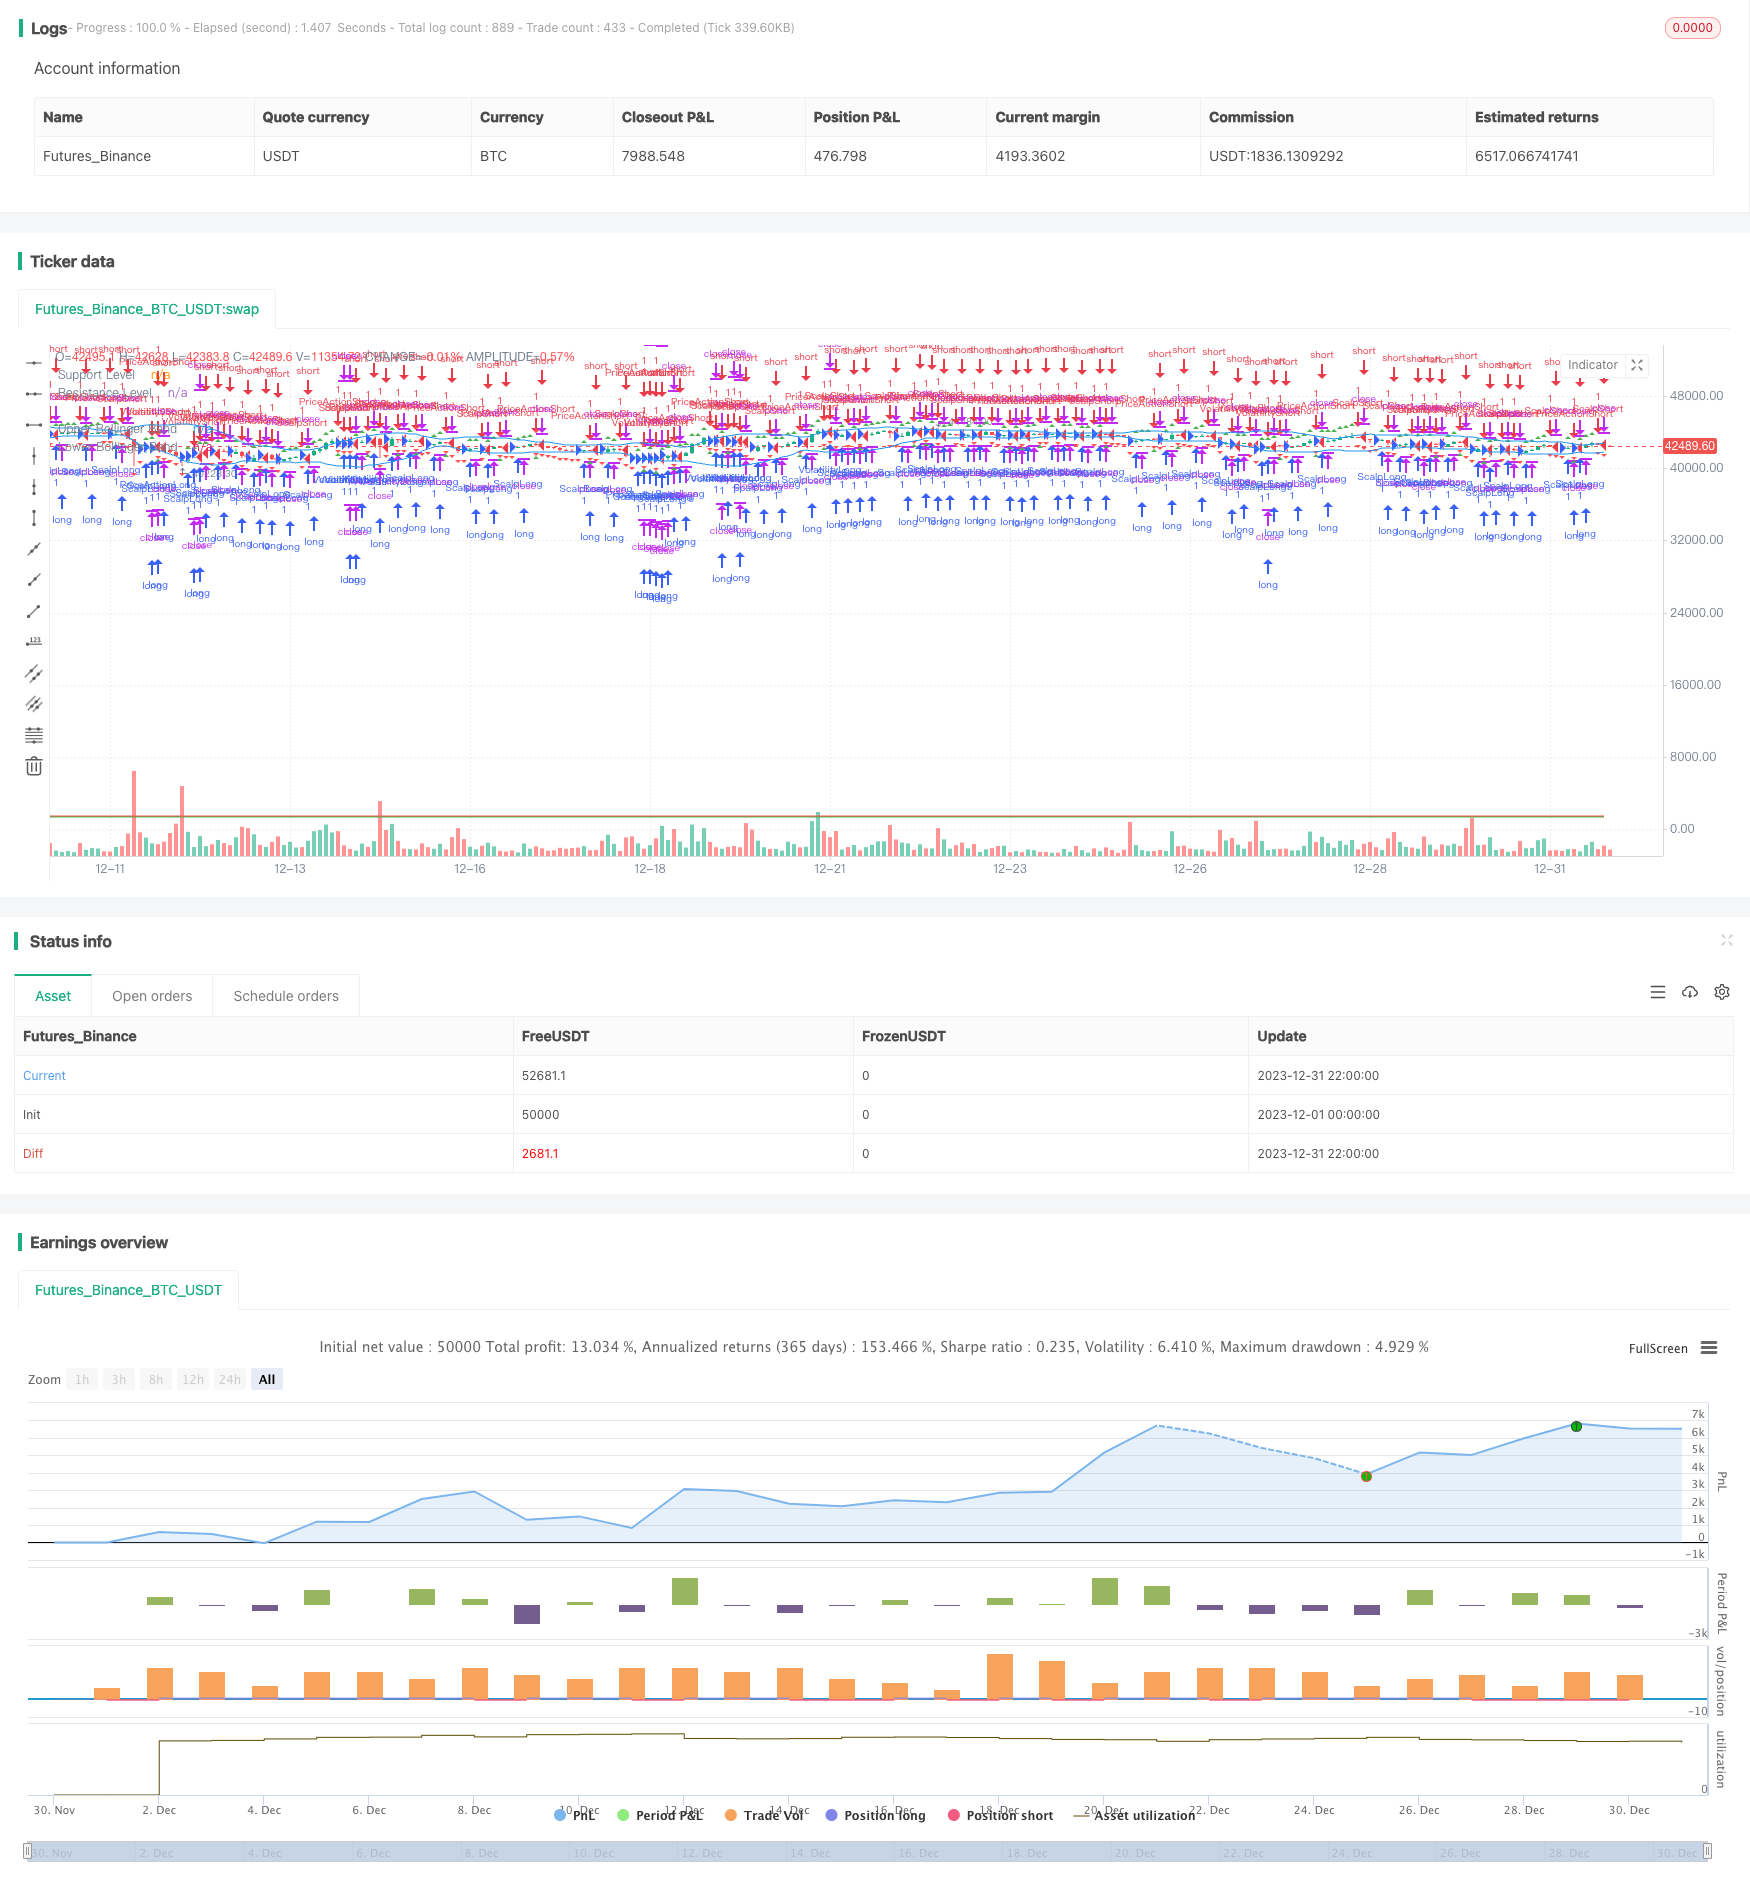
概述
该策略通过组合使用不同的技术指标和交易方法,实现在金市场中自动识别趋势,发现反转机会,进行高效率的跟踪交易。策略适用于多个时间框架,可以在日内短线和中长线上都获得优异的效果。
策略原理
策略主要基于均线交叉、布林带、支撑阻力位、价格形态等多种技术指标进行交易信号的判断。在判断大趋势时,会组合使用快速移动平均线、慢速移动平均线、RSI和MACD指标等进行多角度的确认,精确捕捉趋势反转。在具体入市时,会通过观察布林带、关键价格位的突破以及诸如锤头形态等价格形态形成的信号进行操作。同时,策略也会利用一定的止损和止盈机制来控制风险。
整个策略流程主要可以分为以下步骤:
判断大趋势方向:计算快速MA、慢速MA,当快速MA上穿慢速MA时为看涨,下穿时为看跌。同时结合RSI和MACD指标进行确认。
寻找具体入市点:主要通过观察布林带、关键支撑阻力位的突破以及价格形态信号等入场。
设置止盈止损:通过ATR指标计算止损幅度,设定合理的止盈位置。
过滤假突破:部分指标可能出现错误信号,通过组合使用多个指标进行过滤。
优势分析
该策略具有以下几个优势:
多角度判断:不同指标的组合使用能够从更多维度判断市场,避免单一指标误判的概率。
适用性强:无论是日内还是中长线交易,该策略都可以获得较好效果。
灵活多变:策略包含的交易方法丰富多样,可以适应市场的不同阶段。
风险可控:通过止损和止盈来控制每单的风险敞口,从整体上控制策略的最大回撤。
风险分析
该策略主要存在以下风险:
指标误判的概率:虽然通过多个指标组合的方式降低了误判概率,但是极端行情下依然存在一定的误判可能。这是技术指标交易难以完全规避的风险。
反转不确定性:策略判断反转依据的关键点可能不足以成为真正的趋势转折点,无法完美预测未来趋势。这需要通过止损来控制风险。
假突破风险:突破性事件如表现突然,可能是短期的假突破。这需要通过观察更大级别的时间框架和价格形态进行判断。
参数优化困难:策略包含多个参数,不同的参数对结果有重要影响,但难以穷举调整找到最优参数。这需要通过平衡多种指标并保持参数稳定来减轻。
优化方向
该策略主要可以从以下几个方向进行优化:
模型集成:引入机器学习等模型,辅助判断指标信号的权重和市场概率。
自适应参数优化:通过适当引入一些动态指标或基于价格实体变化的自适应机制来优化参数。
事件驱动交易:在金市场中引入基于事件、消息面等驱动因素作为交易信号来源。
模型对冲组合:构建含长短仓位的组合,不同模型之间互相对冲,可以降低市场系统性风险。
总结
总的来说,该金反转跟踪策略整合运用了多种交易方法,在发现趋势反转的同时控制好风险,是一种适合高频交易的有效策略。通过进一步扩充信号源,引入自适应机制与风险管理模型,该策略还具有很大的优化空间,可以望获得更长久更稳定的超额收益。
/*backtest
start: 2023-12-01 00:00:00
end: 2023-12-31 23:59:59
period: 2h
basePeriod: 15m
exchanges: [{"eid":"Futures_Binance","currency":"BTC_USDT"}]
*/

//@version=5
strategy("PratikMoney_Gold_Swing_v2.0", overlay=true)

// Trend Following
fastMA = ta.sma(close, 50)
slowMA = ta.sma(close, 200)
rsiValue = ta.rsi(close, 14)
[macdLine, signalLine, _] = ta.macd(close, 12, 26, 9)
macdDivergence = macdLine - signalLine
trendUp = ta.crossover(fastMA, slowMA) and rsiValue > 50 and macdLine > 0 and macdDivergence > 0
trendDown = ta.crossunder(fastMA, slowMA) and rsiValue < 50 and macdLine < 0 and macdDivergence < 0

// Breakout Trading
resistanceLevel = input(1500, title="Resistance Level")
supportLevel = input(1400, title="Support Level")

breakoutUp = close > resistanceLevel and close[1] <= resistanceLevel
breakoutDown = close < supportLevel and close[1] >= supportLevel

// Moving Average Crossovers
shortTermMA = ta.sma(close, 9)
longTermMA = ta.sma(close, 21)

maCrossUp = ta.crossover(shortTermMA, longTermMA)
maCrossDown = ta.crossunder(shortTermMA, longTermMA)

// Bollinger Bands
bbUpper = ta.sma(close, 20) + 2 * ta.stdev(close, 20)
bbLower = ta.sma(close, 20) - 2 * ta.stdev(close, 20)

bbBreakoutUp = close > bbUpper and close[1] <= bbUpper
bbBreakoutDown = close < bbLower and close[1] >= bbLower

// Support and Resistance
bounceFromSupport = close < supportLevel and close[1] >= supportLevel
reversalFromResistance = close > resistanceLevel and close[1] <= resistanceLevel

// Fibonacci Retracement
fibonacciLevel = input(0.618, title="Fibonacci Level")

fibRetraceUp = ta.lowest(low, 50) >= ta.highest(high, 50) * (1 - fibonacciLevel)
fibRetraceDown = ta.highest(high, 50) <= ta.lowest(low, 50) * (1 + fibonacciLevel)

// Price Action Trading
pinBar = close < open and low < close[1] and close > open[1]
engulfing = close < open and close[1] > open and close[2] > open[1] and close > open[2]

priceActionLong = pinBar or engulfing and close > open
priceActionShort = pinBar or engulfing and close < open

// Scalping
scalpLong = ta.change(close) > 0.1
scalpShort = ta.change(close) < -0.1

// Volatility Breakout
atrLevel = input(1.5, title="ATR Multiplier")

volatilityBreakoutUp = close > ta.sma(close, 20) + atrLevel * ta.atr(20)
volatilityBreakoutDown = close < ta.sma(close, 20) - atrLevel * ta.atr(20)

// Strategy Execution
strategy.entry("TrendLong", strategy.long, when=trendUp)
strategy.entry("TrendShort", strategy.short, when=trendDown)

strategy.entry("BreakoutLong", strategy.long, when=breakoutUp)
strategy.entry("BreakoutShort", strategy.short, when=breakoutDown)

strategy.entry("VolatilityLong", strategy.long, when=volatilityBreakoutUp)
strategy.entry("VolatilityShort", strategy.short, when=volatilityBreakoutDown)

strategy.entry("PriceActionLong", strategy.long, when=priceActionLong)
strategy.entry("PriceActionShort", strategy.short, when=priceActionShort)

strategy.entry("ScalpLong", strategy.long, when=scalpLong)
strategy.entry("ScalpShort", strategy.short, when=scalpShort)

// Plotting
plot(supportLevel, color=color.green, title="Support Level")
plot(resistanceLevel, color=color.red, title="Resistance Level")

plot(bbUpper, color=color.blue, title="Upper Bollinger Band")
plot(bbLower, color=color.blue, title="Lower Bollinger Band")

// Plotting Price Action Signals
plotshape(series=priceActionLong, title="Price Action Long", color=color.green, style=shape.triangleup, location=location.belowbar)
plotshape(series=priceActionShort, title="Price Action Short", color=color.red, style=shape.triangledown, location=location.abovebar)

// Plotting Scalping Signals
plotshape(series=scalpLong, title="Scalp Long", color=color.green, style=shape.triangleup, location=location.abovebar)
plotshape(series=scalpShort, title="Scalp Short", color=color.red, style=shape.triangledown, location=location.belowbar)