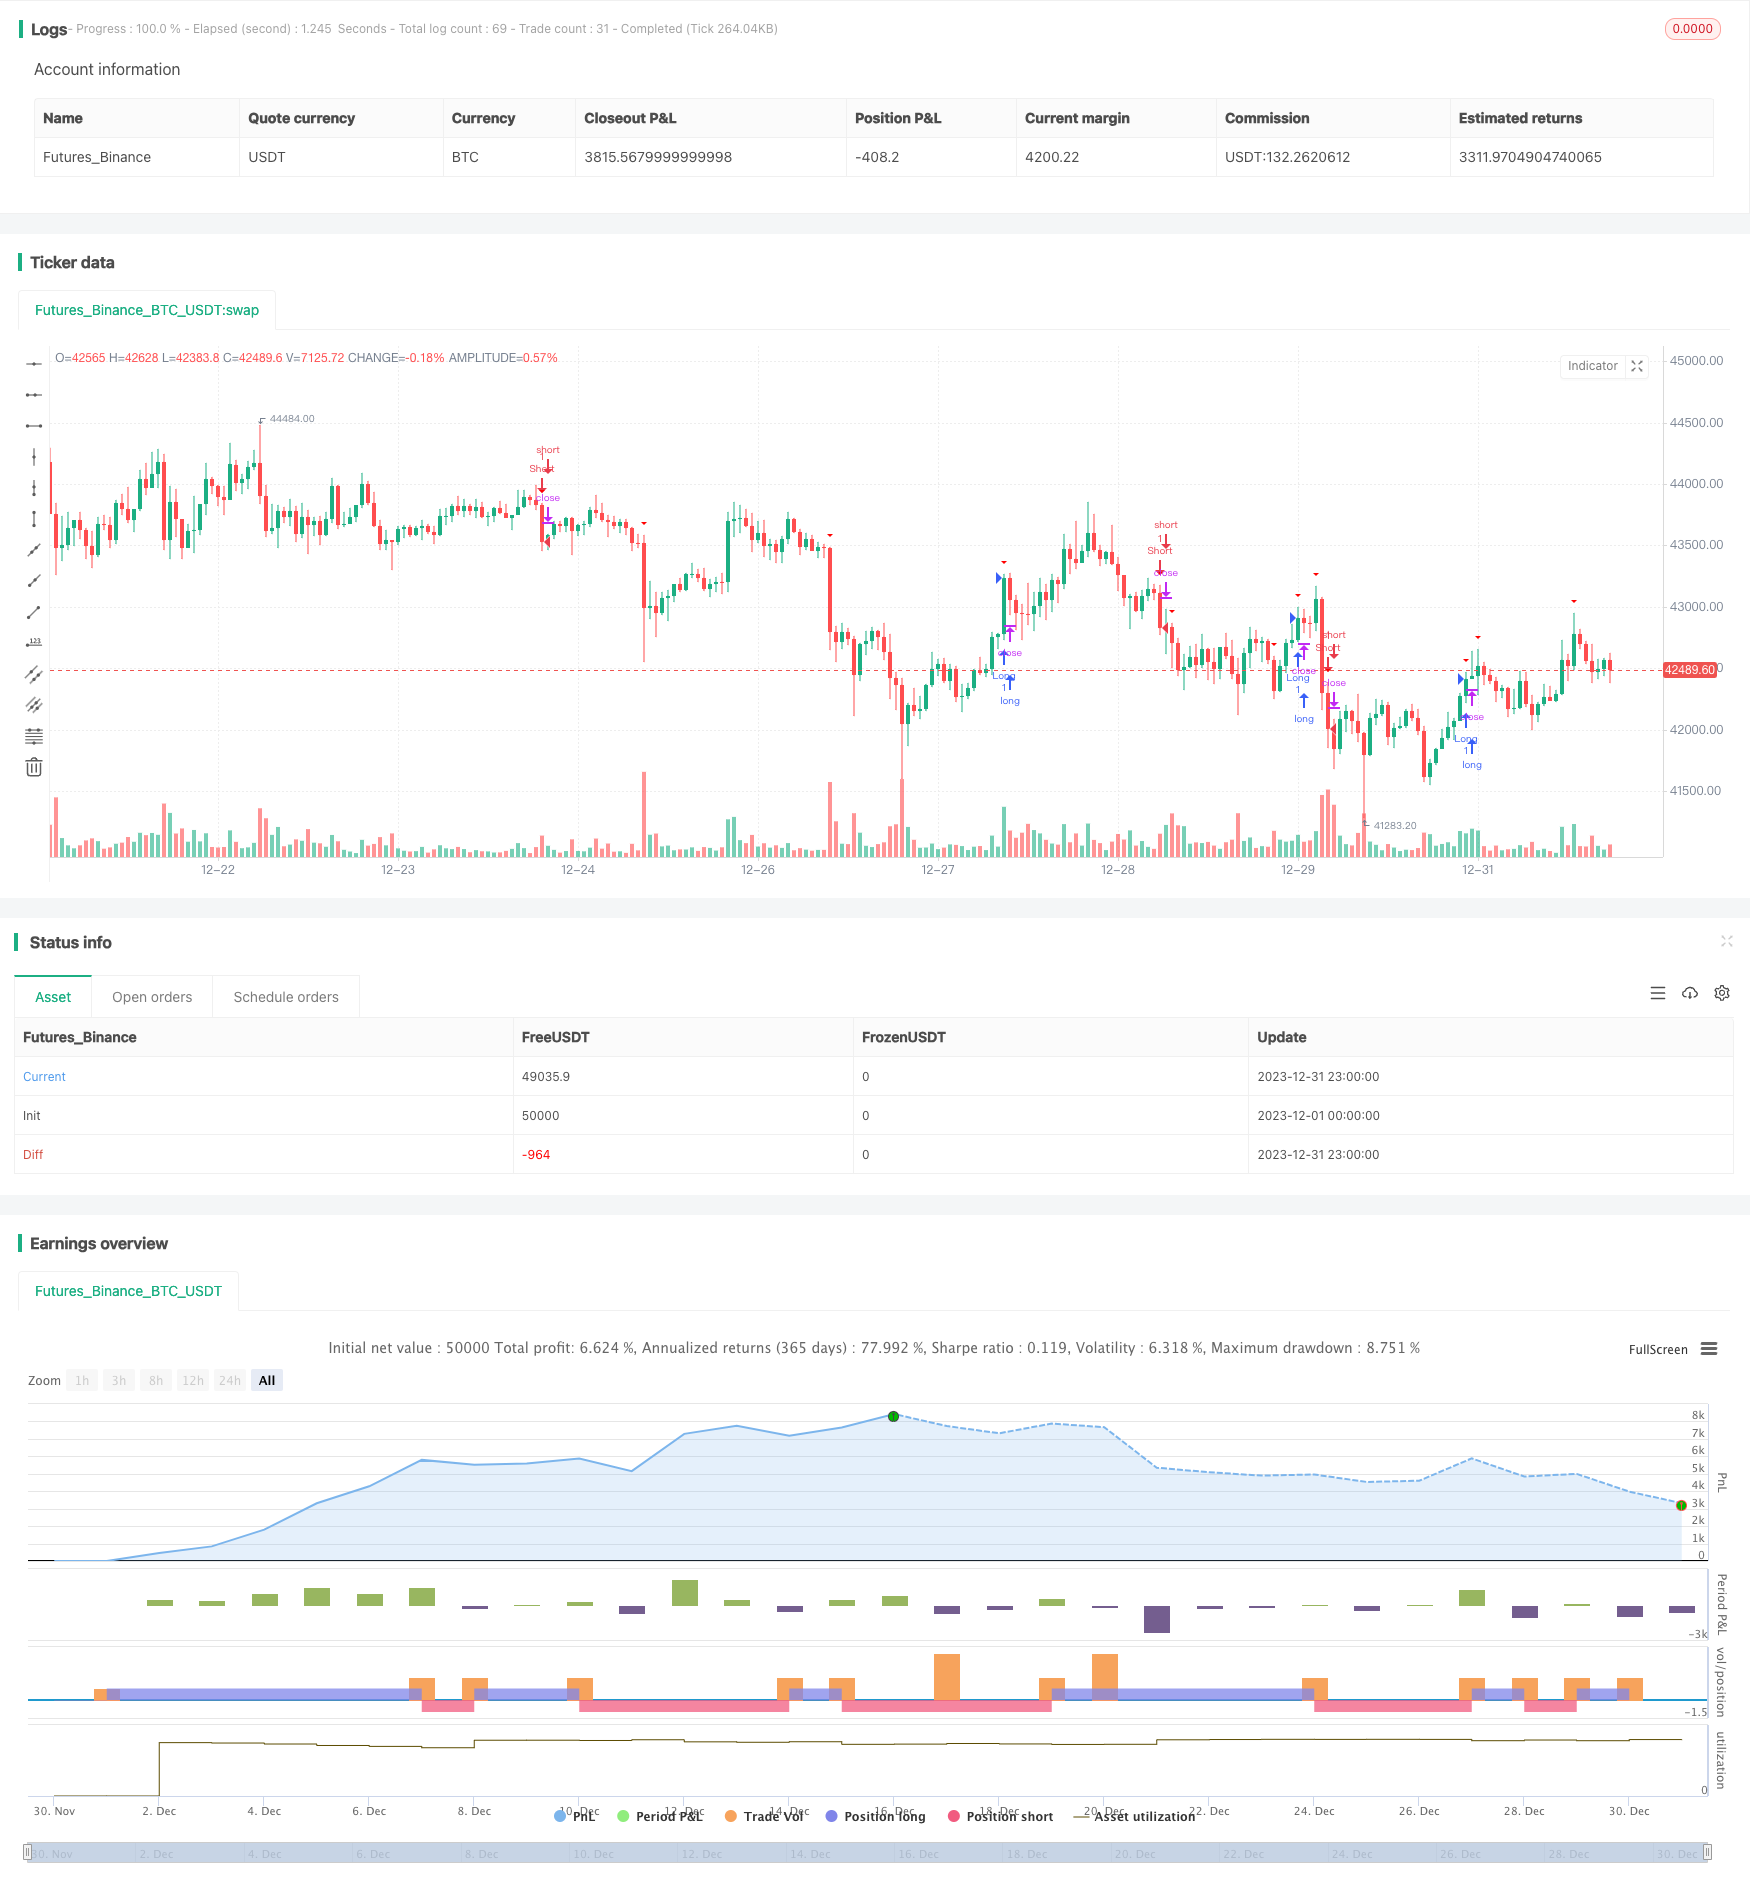
概述
该策略运用布林带指标判断价格是否处于整合期,以及使用突破判断入场和出场。整体来说,该策略主要利用价格整合带来的剧烈行情进行获利。
策略原理
该策略首先计算20日内的收盘价的简单移动平均线作为布林带的中轨,并计算标准差的2倍作为布林带的带宽。当价格高于上轨时判定为突破上轨,当价格低于下轨时判定为突破下轨。
当价格位于布林带中轨上下时,判断为整合期。当检测到突破信号时,做多头入场。当再次突破下轨时,平仓。做空同理。
止损设定为ATR指标的2倍。
优势分析
该策略主要依赖布林带的整合与突破属性,具有以下优势:
- 利用价格整合带来的剧烈行情,潜在获利空间大
- 布林带指标直观,参数优化简单
- 随大趋势运行,避免追顶杀跌
风险分析
该策略也存在一些风险:
- 突破信号可能出现假突破,造成亏损
- 止损设置过大,单笔亏损扩大
- 布林带参数设置不当,失去指标效用
对策:
- 结合价量指标过滤假突破
- 优化止损区间,降低单笔亏损
- 测试不同布林带参数,选择最优参数
优化方向
该策略可以从以下几个方向进行优化:
- 整合判定规则可以引入更多指标,避免错误信号
- 增加趋势过滤,根据趋势方向决定做多做空
- 增加止损方式,如追踪止损等,更好控制风险
总结
该策略整体较为简单直接,通过捕捉价格整合带来的能量聚集实现较大盈利。优化空间较大,可从入场规则、止损方式等方面进行调整,在控制风险的前提下获得更稳定收益。
策略源码
/*backtest
start: 2023-12-01 00:00:00
end: 2023-12-31 23:59:59
period: 1h
basePeriod: 15m
exchanges: [{"eid":"Futures_Binance","currency":"BTC_USDT"}]
*/

//@version=5
strategy("Consolidation Breakout Strategy", shorttitle="CBS", overlay=true)

// Parameters
length = input(20, title="Bollinger Bands Length")
mult = input(2.0, title="Bollinger Bands Multiplier")
risk = input.float(1, title="Risk per Trade (%)") / 100

// Calculate Bollinger Bands
basis = ta.sma(close, length)
dev = mult * ta.stdev(close, length)
upper = basis + dev
lower = basis - dev

// Entry Conditions
consolidating = ta.crossover(close, upper) and ta.crossunder(close, lower)

// Exit Conditions
breakout = ta.crossover(close, upper) or ta.crossunder(close, lower)

// Risk Management
atrVal = ta.atr(14)
stopLoss = atrVal * input.float(2, title="Stop Loss Multiplier", minval=0.1, maxval=5)

// Entry and Exit Conditions
longEntry = breakout and close > upper
shortEntry = breakout and close < lower

if (longEntry)
    strategy.entry("Long", strategy.long)

if (shortEntry)
    strategy.entry("Short", strategy.short)

if (longEntry and close < basis - stopLoss)
    strategy.close("Long Exit")

if (shortEntry and close > basis + stopLoss)
    strategy.close("Short Exit")

// Plot Entry and Exit Points
plotshape(consolidating, style=shape.triangleup, location=location.belowbar, color=color.rgb(30, 255, 0), title="Entry Signal")
plotshape(breakout, style=shape.triangledown, location=location.abovebar, color=color.rgb(255, 0, 0), title="Exit Signal")