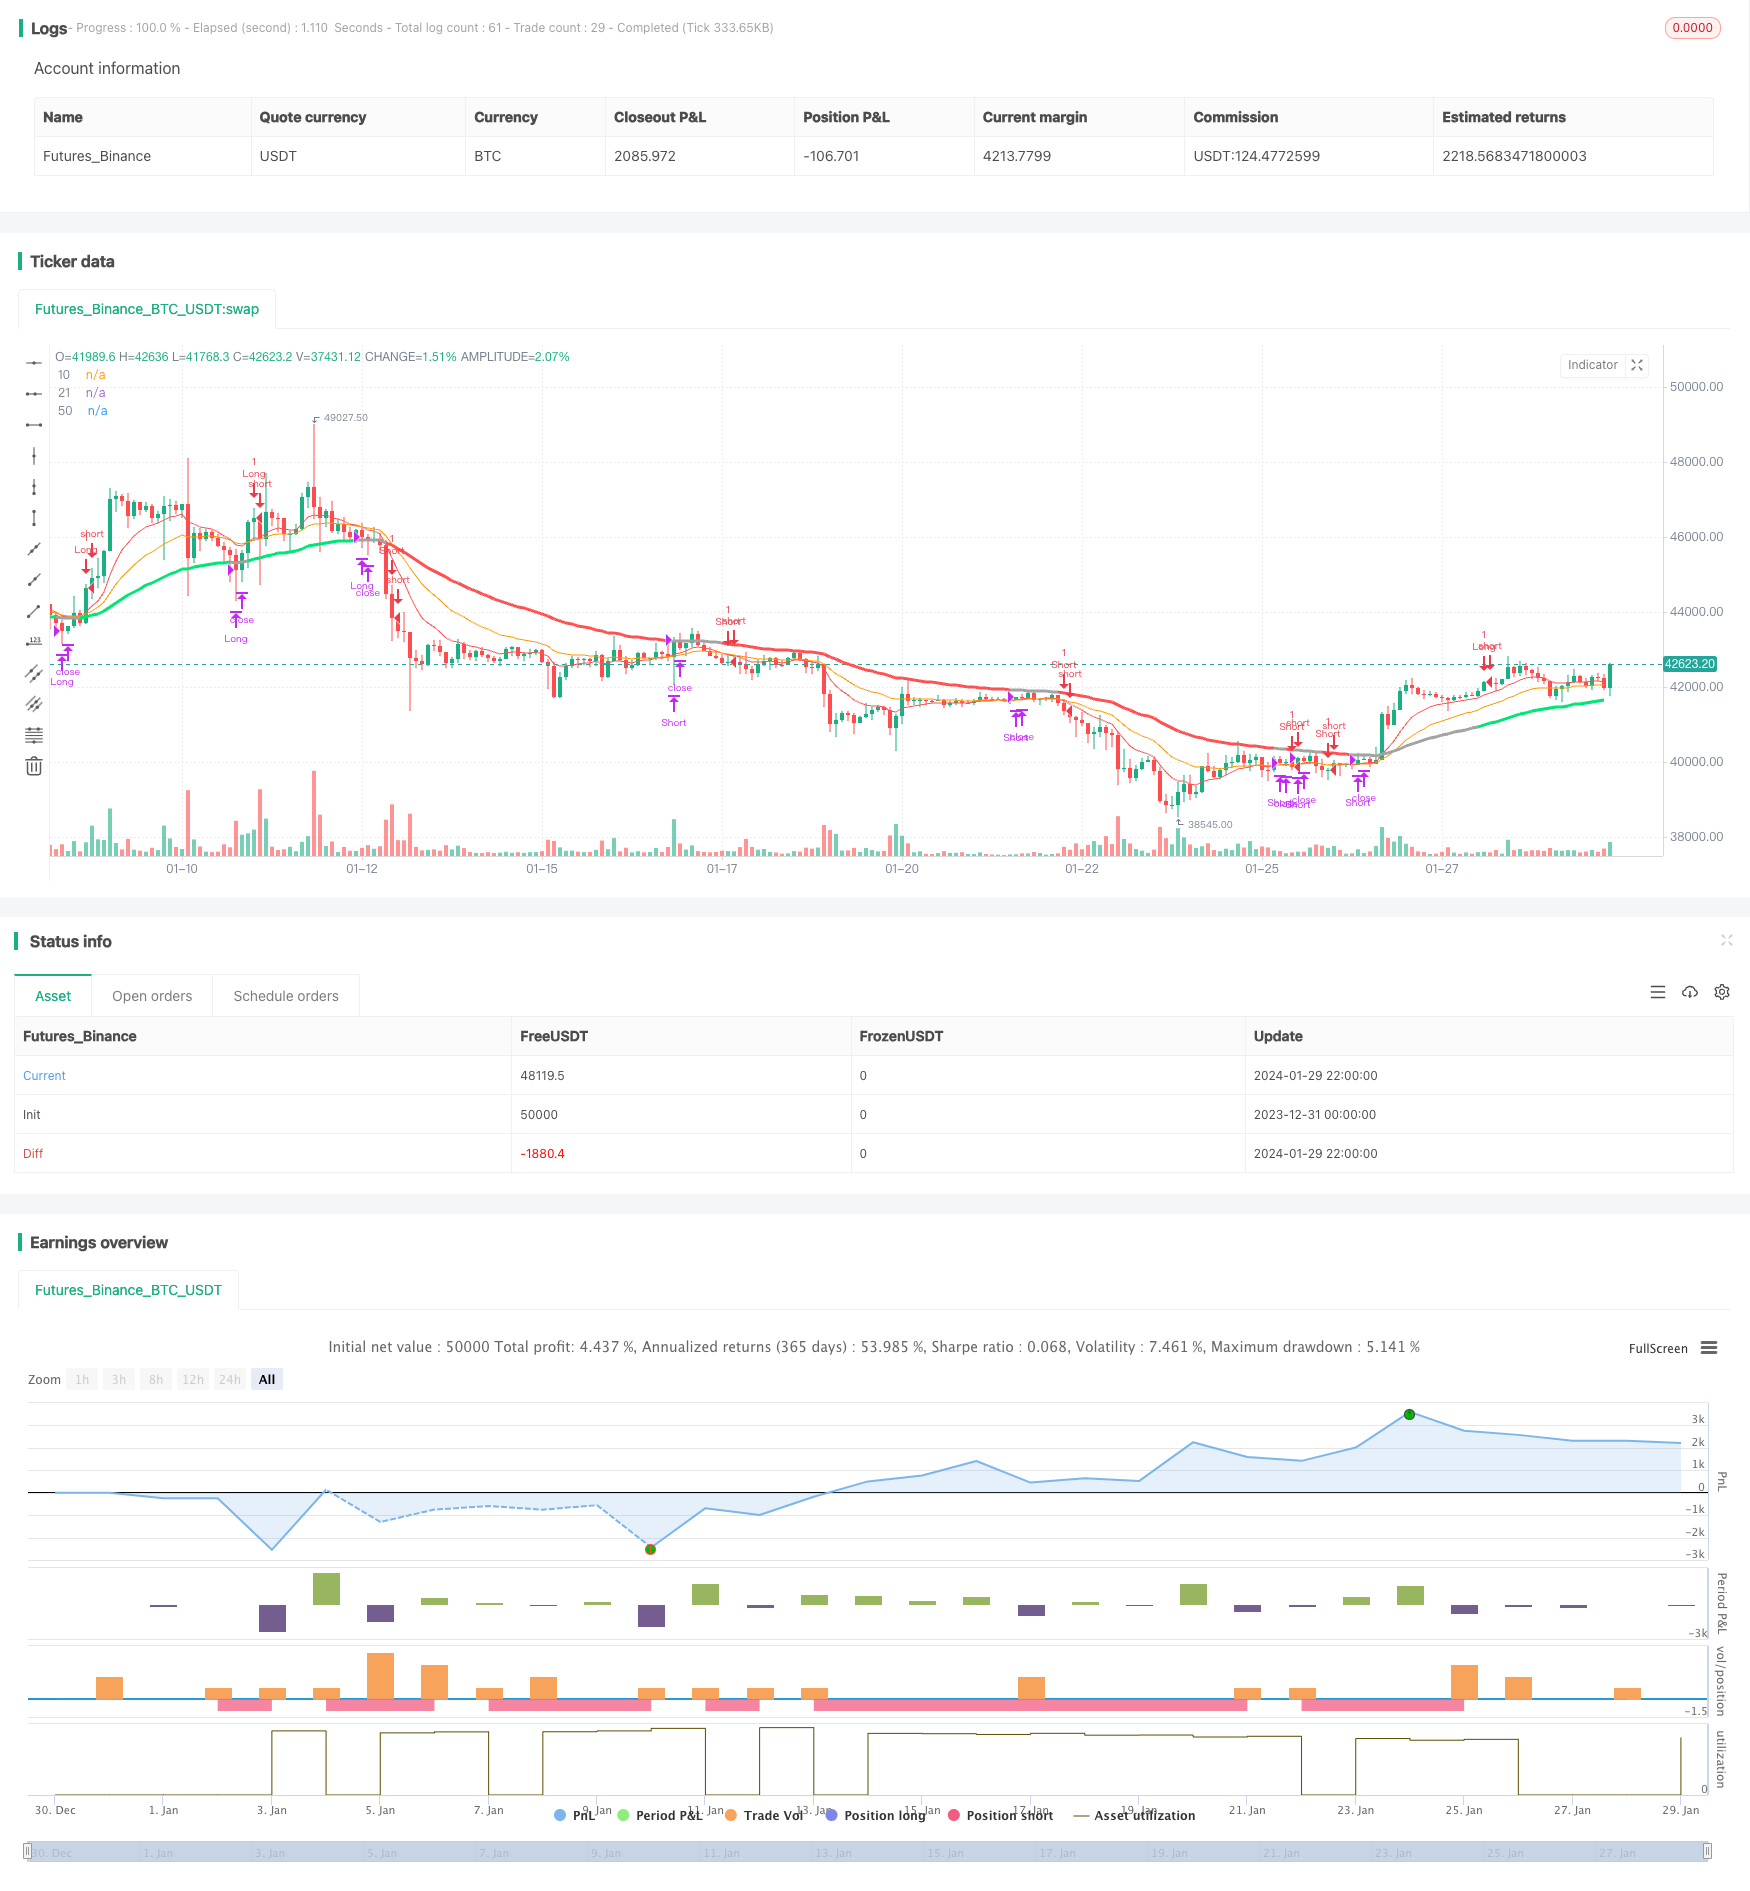
概述
本策略是一种短线震荡交易策略,它结合了EMA均线指标和CCI指标来识别市场的短线趋势和超买超卖状态,以捕捉短线价格波动的机会。
策略原理
该策略主要利用10日EMA,21日EMA和50日EMA三条均线以及CCI指标来判断入场和出场时机。
具体逻辑是: 当短期均线(10日EMA)上穿中期均线(21日EMA)并且短期均线高于长期均线(50日EMA),同时CCI指标大于0时视为多头信号,做多;当短期均线下穿中期均线并且短期均线低于长期均线,同时CCI指标小于0时视为空头信号,做空。
平仓逻辑是短期均线重新跨过中期均线时平仓。
策略优势
结合均线系统和CCI指标,可以有效识别短线价格波动的趋势方向和超买超卖状态。
利用均线金叉和死叉来判断entries和exists,简单实用。
CCI指标的参数和周期设置较为合理,可以滤除部分假信号。
采用多时间周期均线,可以在震荡市中获取较好的操作机会。
策略风险
短线操作波动大,连续止损可能会比较多。
CCI指标参数设置不当可能增多假信号。
震荡盘整理期间,该策略可能出现多次小亏损。
只适合短线频繁操作的交易者,不适合长线持有。
对应的风险应对措施包括:优化CCI参数,调整止损位置,增加 FILTER 条件等。
策略优化方向
可以测试不同长度的EMA均线组合,优化参数。
可以加入其他指标或Filter条件来过滤掉部分假信号。例如MACD,KDJ等。
可以通过动态追踪止损来控制单笔亏损。
可以结合更高时间周期的趋势指标,避免逆势操作。
总结
本策略整体来说是一个典型的短线震荡策略,利用均线指标的金叉死叉结合CCI指标的超买超卖状态来捕捉价格的短期反转机会。该策略适合短线频繁交易,但需要承受一定的止损压力。通过参数优化和增加filter条件可以进一步提高策略稳定性和盈利能力。
策略源码
/*backtest
start: 2023-12-31 00:00:00
end: 2024-01-30 00:00:00
period: 2h
basePeriod: 15m
exchanges: [{"eid":"Futures_Binance","currency":"BTC_USDT"}]
*/

//@version=3
//study(title="Strat CCI EMA scalping", shorttitle="EMA-CCI-strat", overlay=true)
strategy("Strat CCI EMA scalping", shorttitle="EMA-CCI-strat", overlay=true)

exponential = input(true, title="Exponential MA")

// the risk management inputs
inpTakeProfit   = input(defval = 1000, title = "Take Profit", minval = 0)
inpStopLoss     = input(defval = 200, title = "Stop Loss", minval = 0)
inpTrailStop    = input(defval = 200, title = "Trailing Stop Loss", minval = 0)
inpTrailOffset  = input(defval = 0, title = "Trailing Stop Loss Offset", minval = 0)

// === RISK MANAGEMENT VALUE PREP ===
// if an input is less than 1, assuming not wanted so we assign 'na' value to disable it.
useTakeProfit   = inpTakeProfit  >= 1 ? inpTakeProfit  : na
useStopLoss     = inpStopLoss    >= 1 ? inpStopLoss    : na
useTrailStop    = inpTrailStop   >= 1 ? inpTrailStop   : na
useTrailOffset  = inpTrailOffset >= 1 ? inpTrailOffset : na

src = close

ma10 = exponential ? ema(src, 10) : sma(src, 10)
ma21 = exponential ? ema(src, 21) : sma(src, 21)
ma50 = exponential ? ema(src, 50) : sma(src, 50)

xCCI = cci(close, 200)

//buy_cond = cross(ma21, ma50) and ma10 > ma21 and (xCCI > 0)
//sell_cond = cross(ma21, ma50) and ma10 < ma21  and (xCCI < 0)

buy_cond = ma10 > ma21 and ma10 > ma50 and xCCI > 0
sell_cond = ma10 < ma21 and ma10 < ma50 and xCCI < 0


// === STRATEGY - LONG POSITION EXECUTION ===
enterLong() => buy_cond
exitLong() => ma10 < ma21
strategy.entry(id = "Long", long = true, when = enterLong()) // use function or simple condition to decide when to get in
strategy.close(id = "Long", when = exitLong()) // ...and when to get out
// === STRATEGY - SHORT POSITION EXECUTION ===
enterShort() => sell_cond
exitShort() => ma10 > ma21
strategy.entry(id = "Short", long = false, when = enterShort())
strategy.close(id = "Short", when = exitShort())

// === STRATEGY RISK MANAGEMENT EXECUTION ===
// finally, make use of all the earlier values we got prepped
//strategy.exit("Exit Long", from_entry = "Long", profit = useTakeProfit, loss = useStopLoss, trail_points = useTrailStop, trail_offset = useTrailOffset)
//strategy.exit("Exit Short", from_entry = "Short", profit = useTakeProfit, loss = useStopLoss, trail_points = useTrailStop, trail_offset = useTrailOffset)


//longCondition = buy_cond
//if(longCondition)
//    strategy.entry("Long", strategy.long)
//    strategy.exit("Close Long", "Long", when = exitLong())

//shortCondition = sell_cond
//if(shortCondition)
//    strategy.entry("Short", strategy.short)
//    strategy.exit("Close Short", "Short",  when = exitShort())

//plotshape(buy_cond, style=shape.flag, color=green, size=size.normal)
//plotshape(sell_cond, style=shape.flag, color=red, size=size.normal)

c1 = buy_cond==1 ? lime : sell_cond==1 ? red : #a3a3a3 // color

plot( ma10, color=red, style=line, title="10", linewidth=1)
plot( ma21, color=orange, style=line, title="21", linewidth=1)
plot( ma50, color=c1, style=line, title="50", linewidth=3)

//alertcondition(buy_cond, title = "Buy Condition", message = "Buy Condition Alert")
//alertcondition(sell_cond, title = "Sell Condition", message = "Sell Condition Alert")