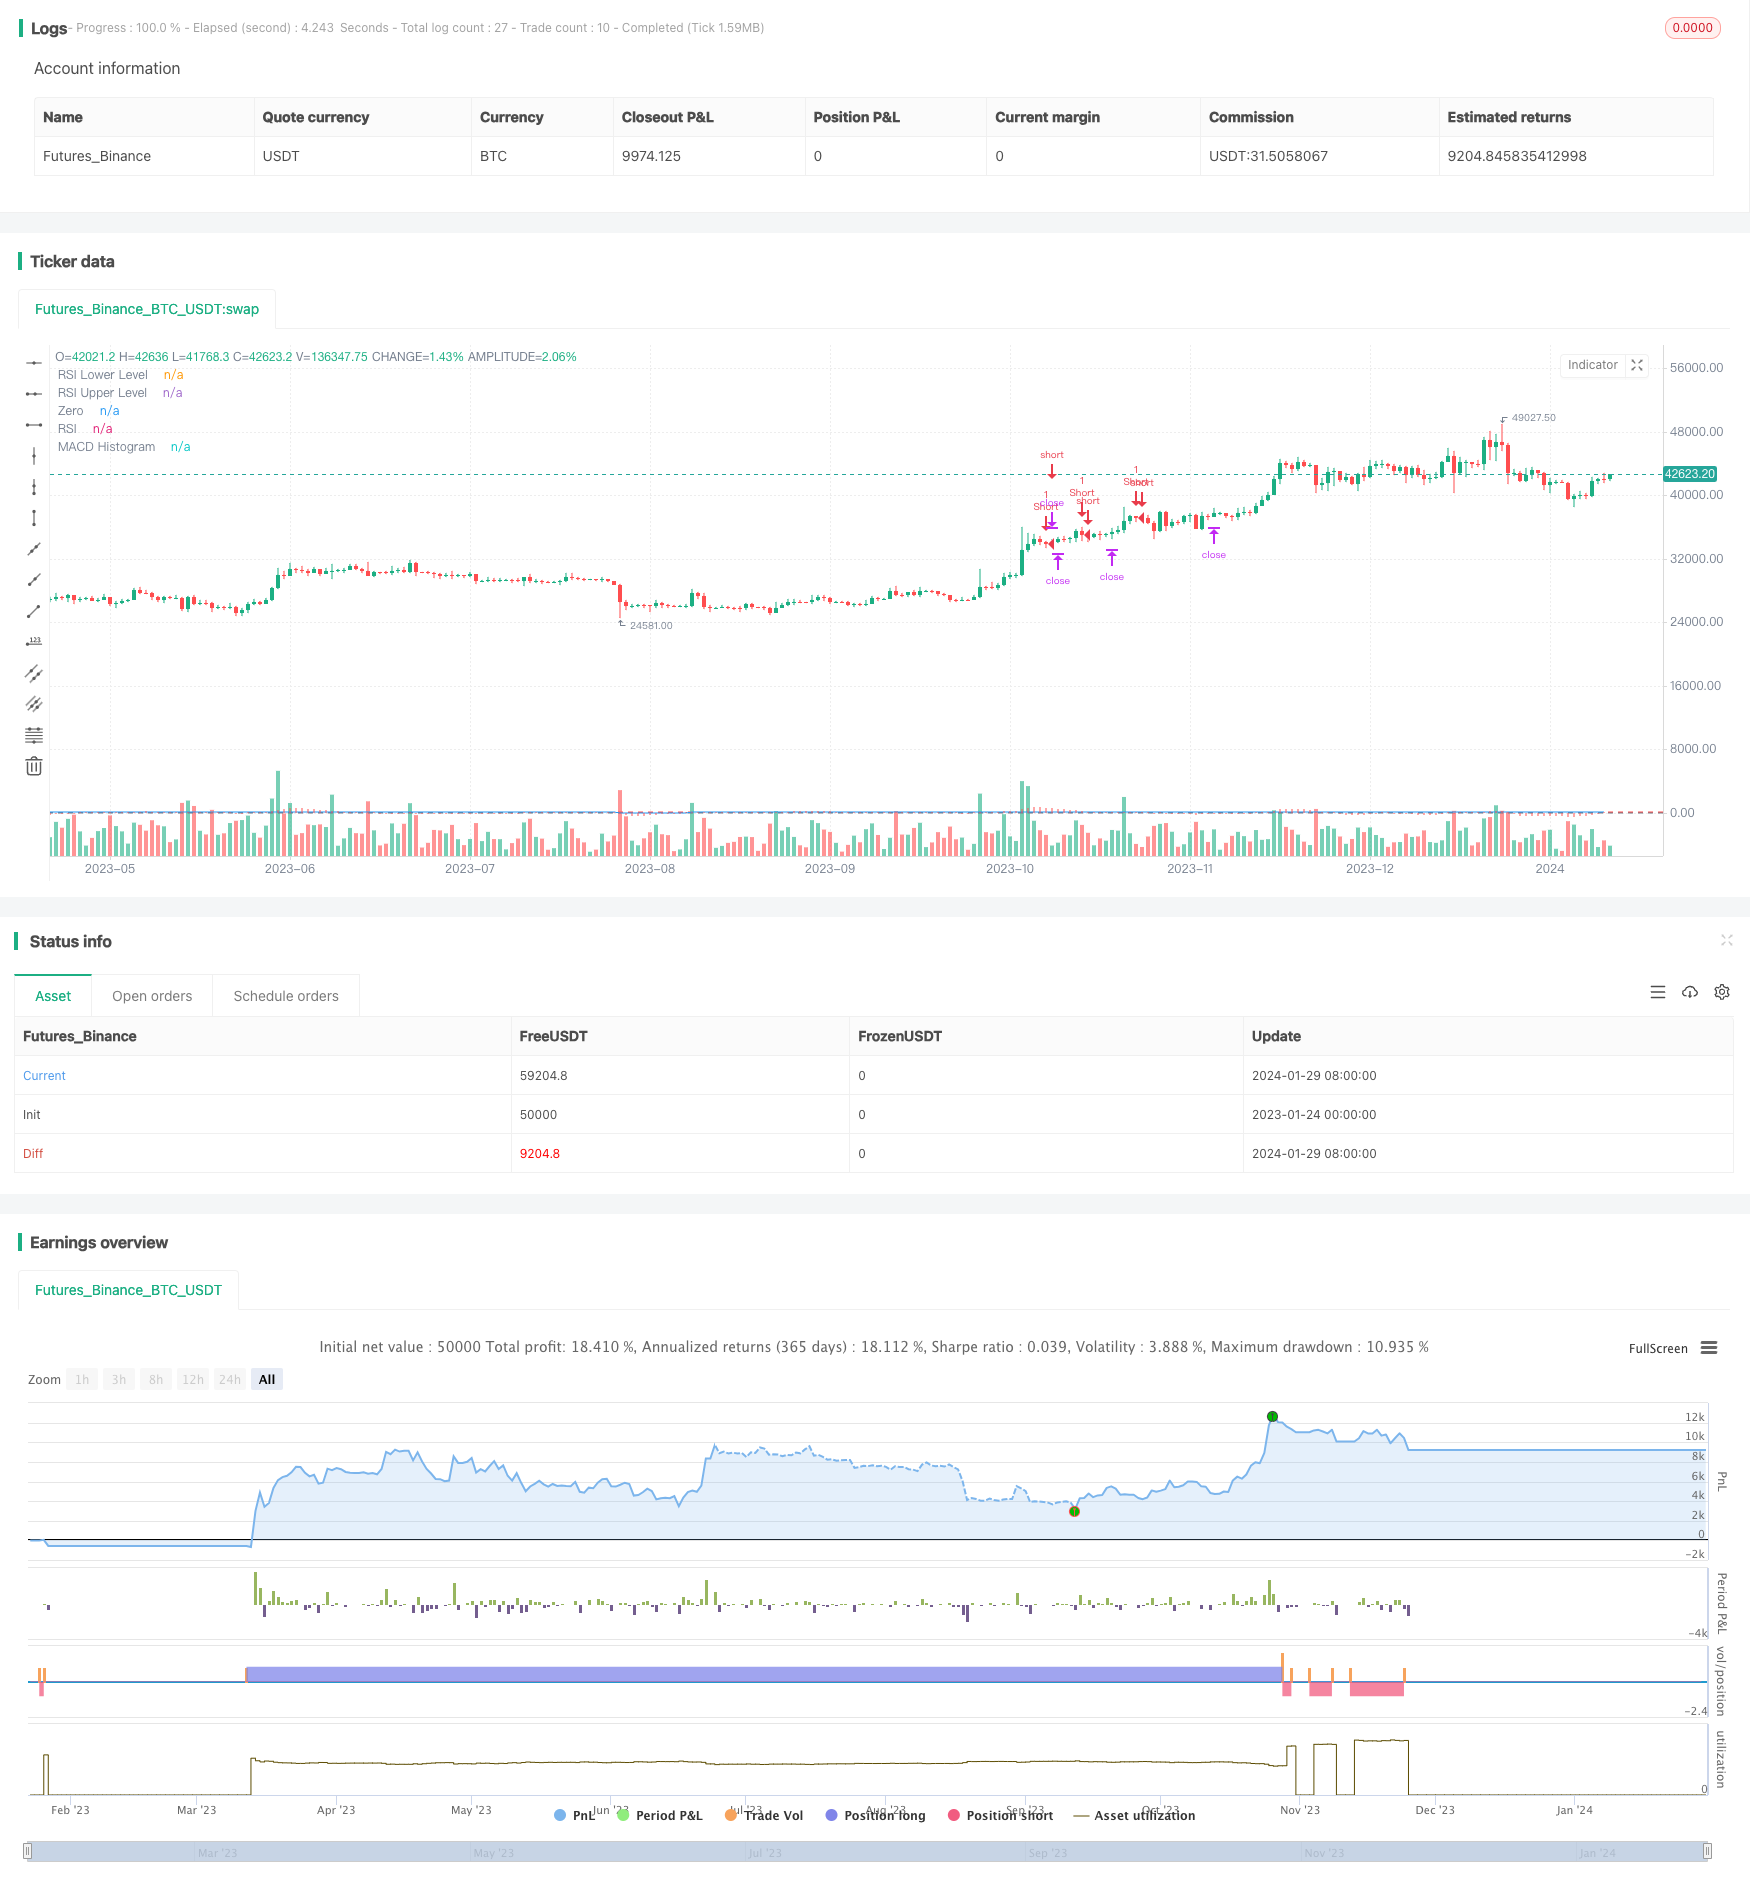
概述
本策略结合相对强弱指数(RSI)和移动平均聚散指标(MACD)来识别BTC的交易机会。当RSI低于30时和MACD线低于信号线且MACD Histogram小于-100时做多;当RSI高于80并且MACD线高于信号线且MACD Histogram大于250时做空。该策略还使用了追踪止损来锁定利润。
策略原理
使用RSI指标来判断市场是否超卖或超买。RSI低于30视为超卖信号,高于80视为超买信号。
使用MACD指标的MACD线和信号线的金叉死叉来判断买卖时机。当MACD线上穿信号线时为买入信号;当MACD线下穿信号线时为卖出信号。
结合RSI指标和MACD指标的信号,形成该策略的入场条件。
使用追踪止损来锁定利润,追踪止损根据持仓盈亏来实时更新,可以有效控制风险。
优势分析
该策略结合RSI和MACD两个指标,可以有效过滤假信号。
RSI指标可以有效判断市场超买超卖现象。MACD指标可以抓住趋势的变化。两者结合使用效果好。
使用追踪止损可以根据市场实时行情来止损,最大程度锁定利润,控制风险。
策略参数较少,易于实现。
风险分析
单一品种策略,品种本身存在的系统性风险。
RSI指标在区间市和底部反弹时可能产生虚假信号。MACD指标在震荡行情中也可能产生错误信号。
追踪止损在大幅行情中可能被突破,无法控制风险。
参数设置不当可能导致交易频繁或漏单。
优化方向
可以考虑结合其他指标如布林线、KD等来发出交易信号。
可以研究不同品种之间的相关性,建立多品种套利策略。
可以优化止损策略,如及时止损、平均止损等方式。
可以结合机器学习等方式来智能优化参数。
总结
本策略是一套基于RSI和MACD指标判断超买超卖的趋势跟踪策略。它有效结合了技术指标的优势,可以抓住市场的趋势变化。同时,策略简单直接,易于实施。通过优化可以进一步扩展该策略的应用。
策略源码
/*backtest
start: 2023-01-24 00:00:00
end: 2024-01-30 00:00:00
period: 1d
basePeriod: 1h
exchanges: [{"eid":"Futures_Binance","currency":"BTC_USDT"}]
*/

//@version=5
strategy("BTC/USDT RSI and MACD Strategy", overlay = true)

// Define the RSI period
rsiPeriod = input(14, "RSI Period")

// Calculate the RSI
rsi = ta.rsi(close, rsiPeriod)

// Define the MACD parameters
macdShort = input(12, "MACD Short Period")
macdLong = input(26, "MACD Long Period")
macdSignal = input(9, "MACD Signal Period")

// Calculate the MACD
[macdLine, signalLine, _] = ta.macd(close, macdShort, macdLong, macdSignal)

// Define the trailing stop level
trailing_stop_loss_factor = input.float(2.50, "Trailing Stop Loss Factor", step = 0.01)

// Define the entry and exit conditions
enterLong = ta.crossover(rsi, 30) and macdLine < signalLine and macdLine < -100
enterShort = ta.crossunder(rsi, 83) and macdLine > signalLine and macdLine > 250

// Submit the orders
if (enterLong)
    strategy.entry("Long", strategy.long)
if (enterShort)
    strategy.entry("Short", strategy.short)

// Trailing Stop Loss
longTrailingStopLoss = strategy.position_avg_price * (1 - trailing_stop_loss_factor / 100)
shortTrailingStopLoss = strategy.position_avg_price * (1 + trailing_stop_loss_factor / 100)
if strategy.position_size > 0
    strategy.exit("Exit Long", "Long", stop  = longTrailingStopLoss)
if strategy.position_size < 0
    strategy.exit("Exit Short", "Short", stop = shortTrailingStopLoss)

// Plot the indicators
plot(rsi, "RSI", color=color.blue)
hline(20, "RSI Lower Level", color=color.green)
hline(80, "RSI Upper Level", color=color.red)
plot(macdLine - signalLine, "MACD Histogram", color=color.red, style=plot.style_histogram)
hline(0, "Zero", color=color.gray)