概述
本策略基于双边三点移位均线指标,通过计算最近N周期的最高价、最低价和收盘价的均值,实现判断价格趋势和发出交易信号的功能。该策略适用于中短线交易,可以有效过滤市场噪音,顺势捕捉价格趋势。
策略原理
本策略的核心指标是双边三点移位均线(XHL2、XHLC3)。其中,XHL2计算最近N周期的最高价和最低价的均值。XHLC3计算最近N周期的最高价、最低价和收盘价的均值。这两个指标可以有效平滑价格数据,过滤掉短期波动的影响。
策略通过计算XHL2、XHLC3和收盘价的差值nMF判断价格走势。当nMF大于一个因子时,判断为价格上涨趋势;当nMF小于负的因子时,判断为价格下跌趋势。结合交易量,计算出指标nRES,其大于0表示买入信号,小于0表示卖出信号。根据nRES的正负和大小关系判断趋势方向和产生交易信号。
优势分析
本策略的优势有:
使用双边三点移位均线指标,可以有效过滤市场噪音,判断价格中长期趋势;
结合交易量变化,可以更准确判断资金流向,发出交易信号;
策略参数较少,方法简单易懂,容易实施;
可灵活设定持仓方向,适用于不同类型的投资者。
风险分析
本策略的主要风险有:
参数设置不当可能导致交易信号错误;
长期强势行情时,策略可能产生过多错误交易信号;
行情剧烈波动时,止损设置过小可能增加亏损风险。
对应解决方法:
优化参数,结合回测确定最佳参数;
结合趋势和支持阻力判断信号的可靠性;
适当放宽止损幅度,控制单笔损失。
优化方向
本策略的优化方向:
优化均线参数和交易量参数,提高指标的敏感性;
增加趋势判断指标,提高交易信号准确性;
增加止损策略,降低亏损风险;
结合机器学习方法,实现参数的自动优化。
总结
本策略基于双边三点移位均线指标设计,判断价格中长期趋势方向,利用交易量变化确认资金流入流出,最终产生买入卖出交易信号。策略优化空间较大,可从多个维度进行改进,使其适应更加复杂的市场环境。
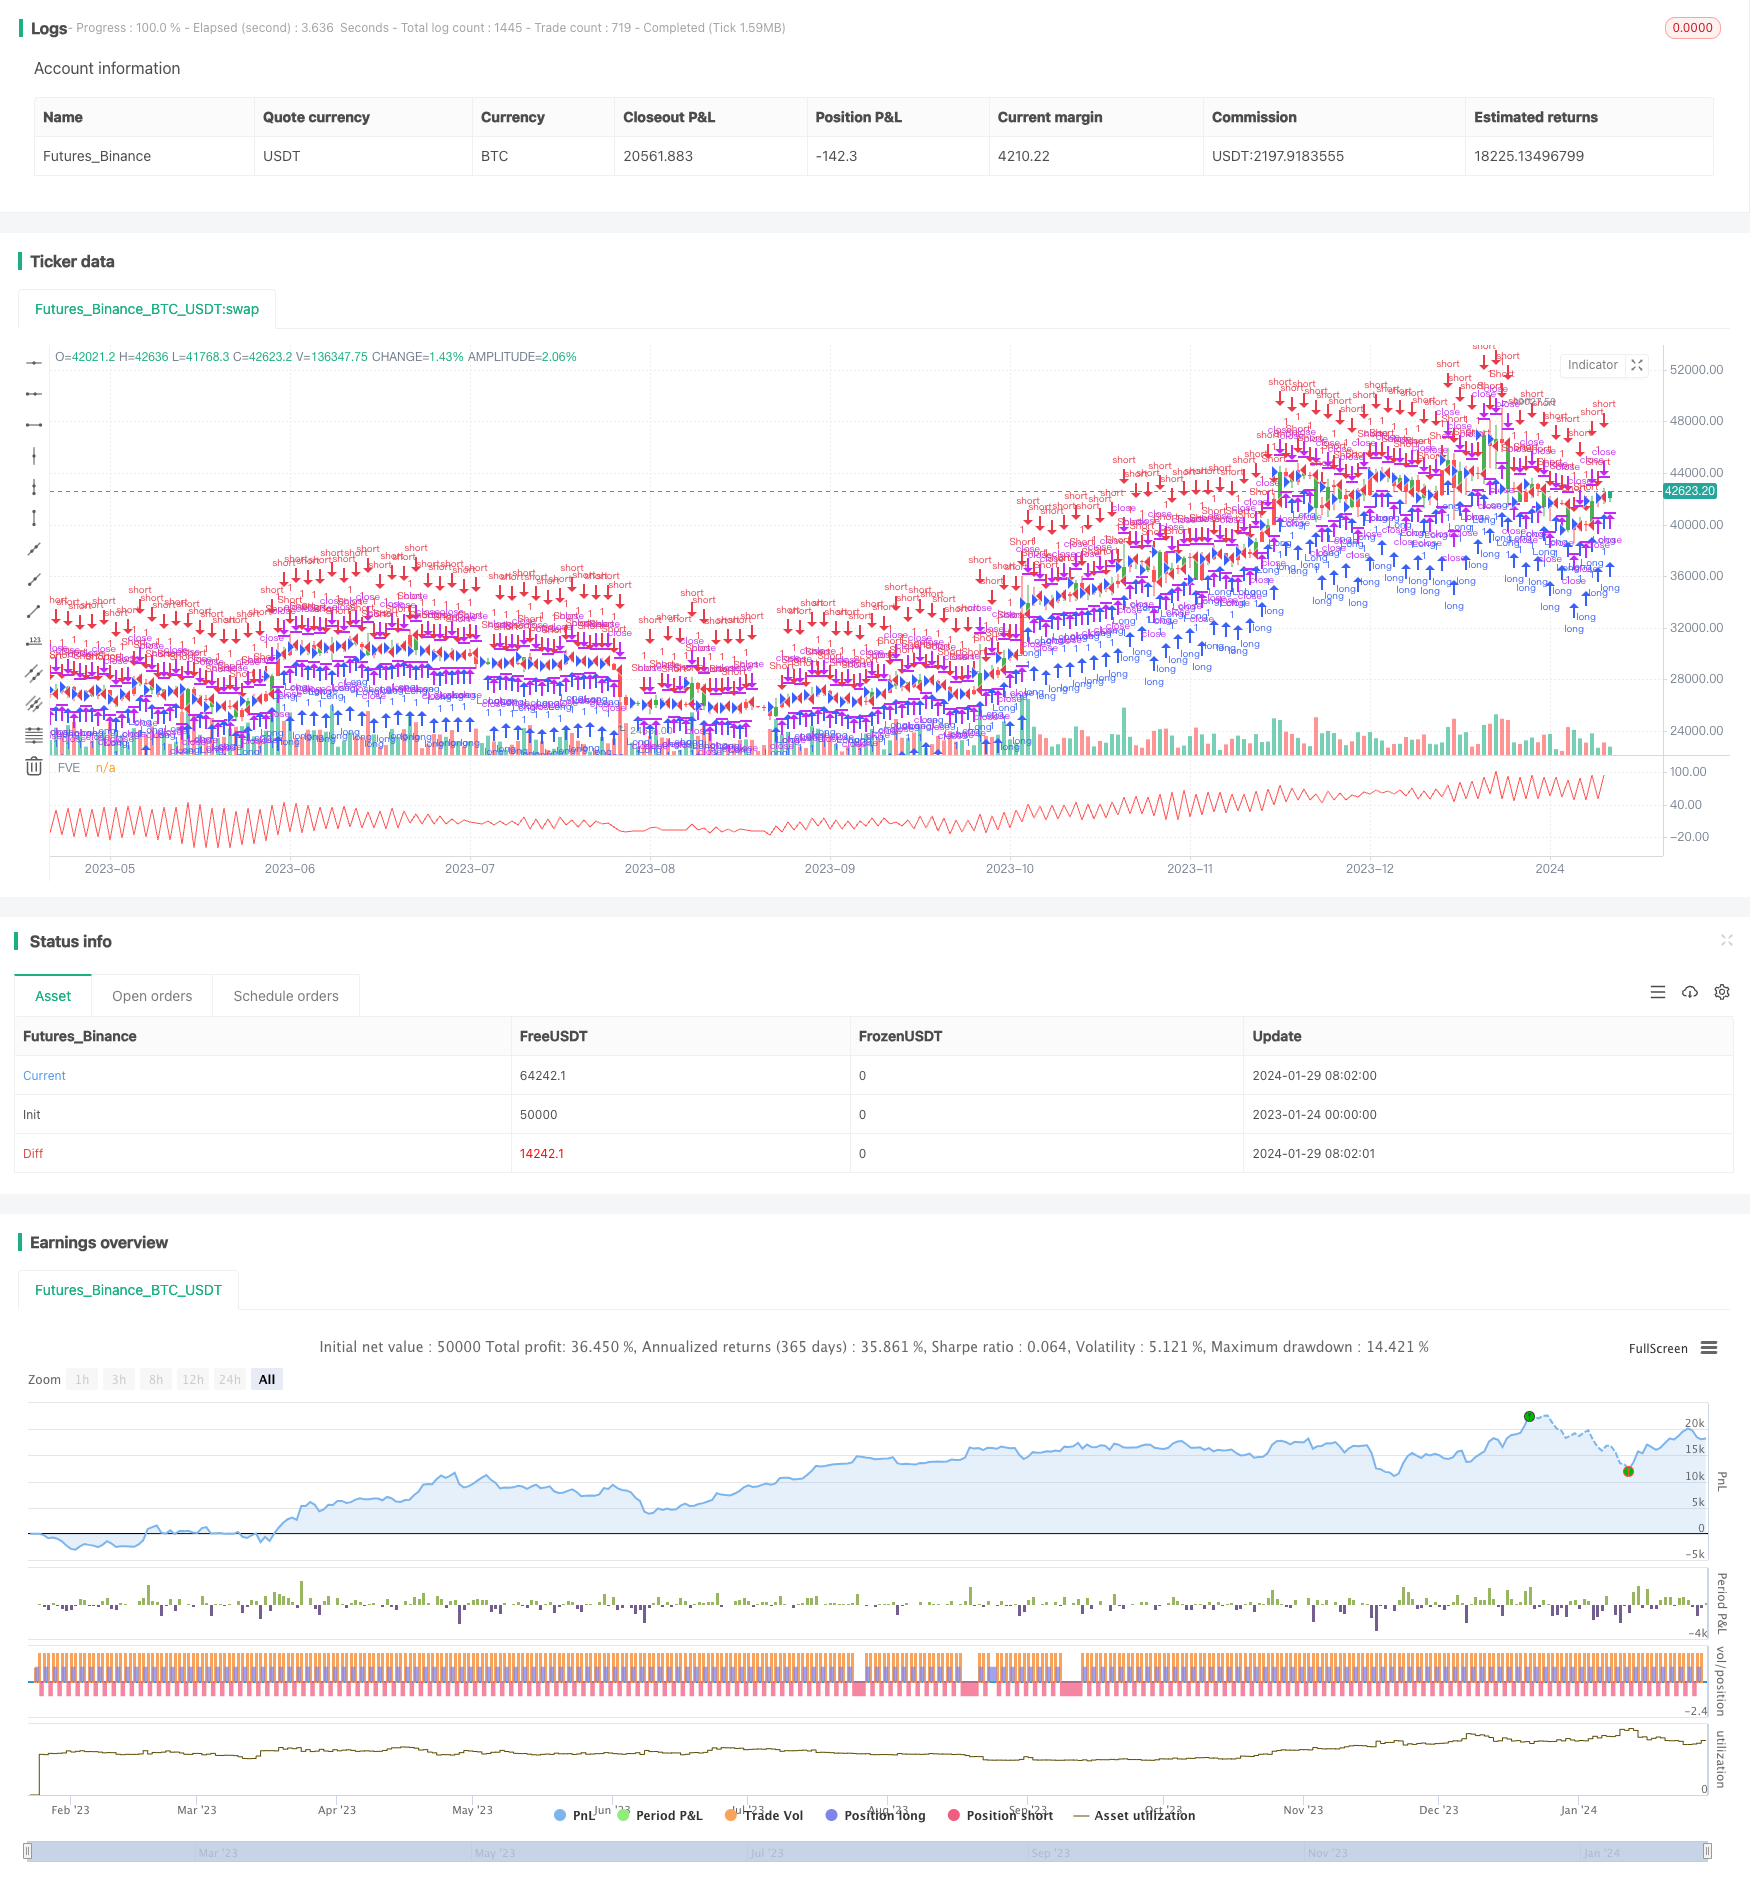
/*backtest
start: 2023-01-24 00:00:00
end: 2024-01-30 00:00:00
period: 1d
basePeriod: 1h
exchanges: [{"eid":"Futures_Binance","currency":"BTC_USDT"}]
*/

//@version=2
////////////////////////////////////////////////////////////
//  Copyright by HPotter v1.0 25/06/2018
// The FVE is a pure volume indicator. Unlike most of the other indicators
// (except OBV), price change doesn?t come into the equation for the FVE (price
// is not multiplied by volume), but is only used to determine whether money is
// flowing in or out of the stock. This is contrary to the current trend in the
// design of modern money flow indicators. The author decided against a price-volume
// indicator for the following reasons:
// - A pure volume indicator has more power to contradict.
// - The number of buyers or sellers (which is assessed by volume) will be the same,
//     regardless of the price fluctuation.
// - Price-volume indicators tend to spike excessively at breakouts or breakdowns.
//
// You can change long to short in the Input Settings
// WARNING:
// - For purpose educate only
// - This script to change bars colors.
////////////////////////////////////////////////////////////
strategy(title="Finite Volume Elements (FVE) Backtest", shorttitle="FVE")
Period = input(22, minval=1)
Factor = input(0.3, maxval=1)
reverse = input(false, title="Trade reverse")
xhl2 = hl2
xhlc3 = hlc3
xClose = close
xVolume = volume
xSMAV = sma(xVolume, Period)
nMF = xClose - xhl2 + xhlc3 - xhlc3[1]
nVlm = iff(nMF > Factor * xClose / 100,  xVolume,
         iff(nMF < -Factor * xClose / 100, -xVolume, 0))
nRes = nz(nRes[1],0) + ((nVlm / xSMAV) / Period) * 100
pos = iff(nRes > nRes[1] and nRes > nRes[2], 1,
         iff(nRes < nRes[1] and nRes < nRes[2], -1, nz(pos[1], 0)))
possig = iff(reverse and pos == 1, -1,
          iff(reverse and pos == -1, 1, pos))
if (possig == 1)
    strategy.entry("Long", strategy.long)
if (possig == -1)
    strategy.entry("Short", strategy.short)
barcolor(possig == -1 ? red: possig == 1 ? green : blue )
plot(nRes, color=red, title="FVE")