SuperTrend RSI EMA Crossover Strategy

Author: ChaoZhang, Date: 2024-01-31 16:16:11
Tags:

img

Strategy Overview: This strategy combines the SuperTrend indicator, Relative Strength Index (RSI) and Exponential Moving Average (EMA) to identify buy signals. It generates buy signals only when the close price is above the SuperTrend line, RSI is greater than 70 and the price is above the 9-day EMA.

Strategy Logic:

  1. SuperTrend indicator is used to determine the price trend and overbought/oversold areas. Price above SuperTrend suggests an uptrend while price below SuperTrend suggests a downtrend.

  2. RSI indicates whether the price has entered overbought or oversold status. RSI above 70 represents an overbought state while below 30 is oversold.

  3. EMA checks if the price can break through its short-term moving average during an uptrend. Only when price is higher than the 9-day EMA, it has a breakthrough signal meaning.

  4. This strategy believes there is a stronger buy signal when SuperTrend, RSI and EMA indicators give synchronized signals. This can effectively filter out some false breakthrough noise trades.

Advantage Analysis:

  1. Integrating multiple indicators can effectively filter out false breakthrough trades and improve strategy win rate.

  2. Considering trend, strength index and moving average indicators together can identify high probability buy points.

  3. Relatively simple strategy logic, easy to understand and implement, suitable for algorithmic trading.

  4. Parameters can be adjusted for different markets, better adaptability.

Risk Analysis:

  1. Single buy rule without considering stop loss to reduce risk.

  2. No sell exit mechanism requires manual stop loss tracking, increasing operation risk.

  3. Improper parameter settings may miss buy opportunities or generate wrong signals.

  4. Massive backtesting experiments needed to find optimum parameters.

Optimization:

  1. Add stop loss and take profit to exit loss trades and lock in profits automatically.

  2. Optimize parameters to find best combination, using methods like grid search and genetic algorithms.

  3. Add sell signals to build a complete system. Sell signals can combine Volatility Stop methods.

  4. Consider machine learning models like LSTM and RNN for feature extraction and improve accuracy.

  5. Containerize strategy for cloud-native scaling on Kubernetes to improve parallelization.

Conclusion: This strategy combines SuperTrend, RSI and EMA indicators for buying decisions when all three give synchronized signals, which can filter out false signals effectively and improve accuracy. But it can be further optimized by adding stop loss, finding optimum parameters, adding exit rules etc to build a more complete and optimized trading system.


/*backtest
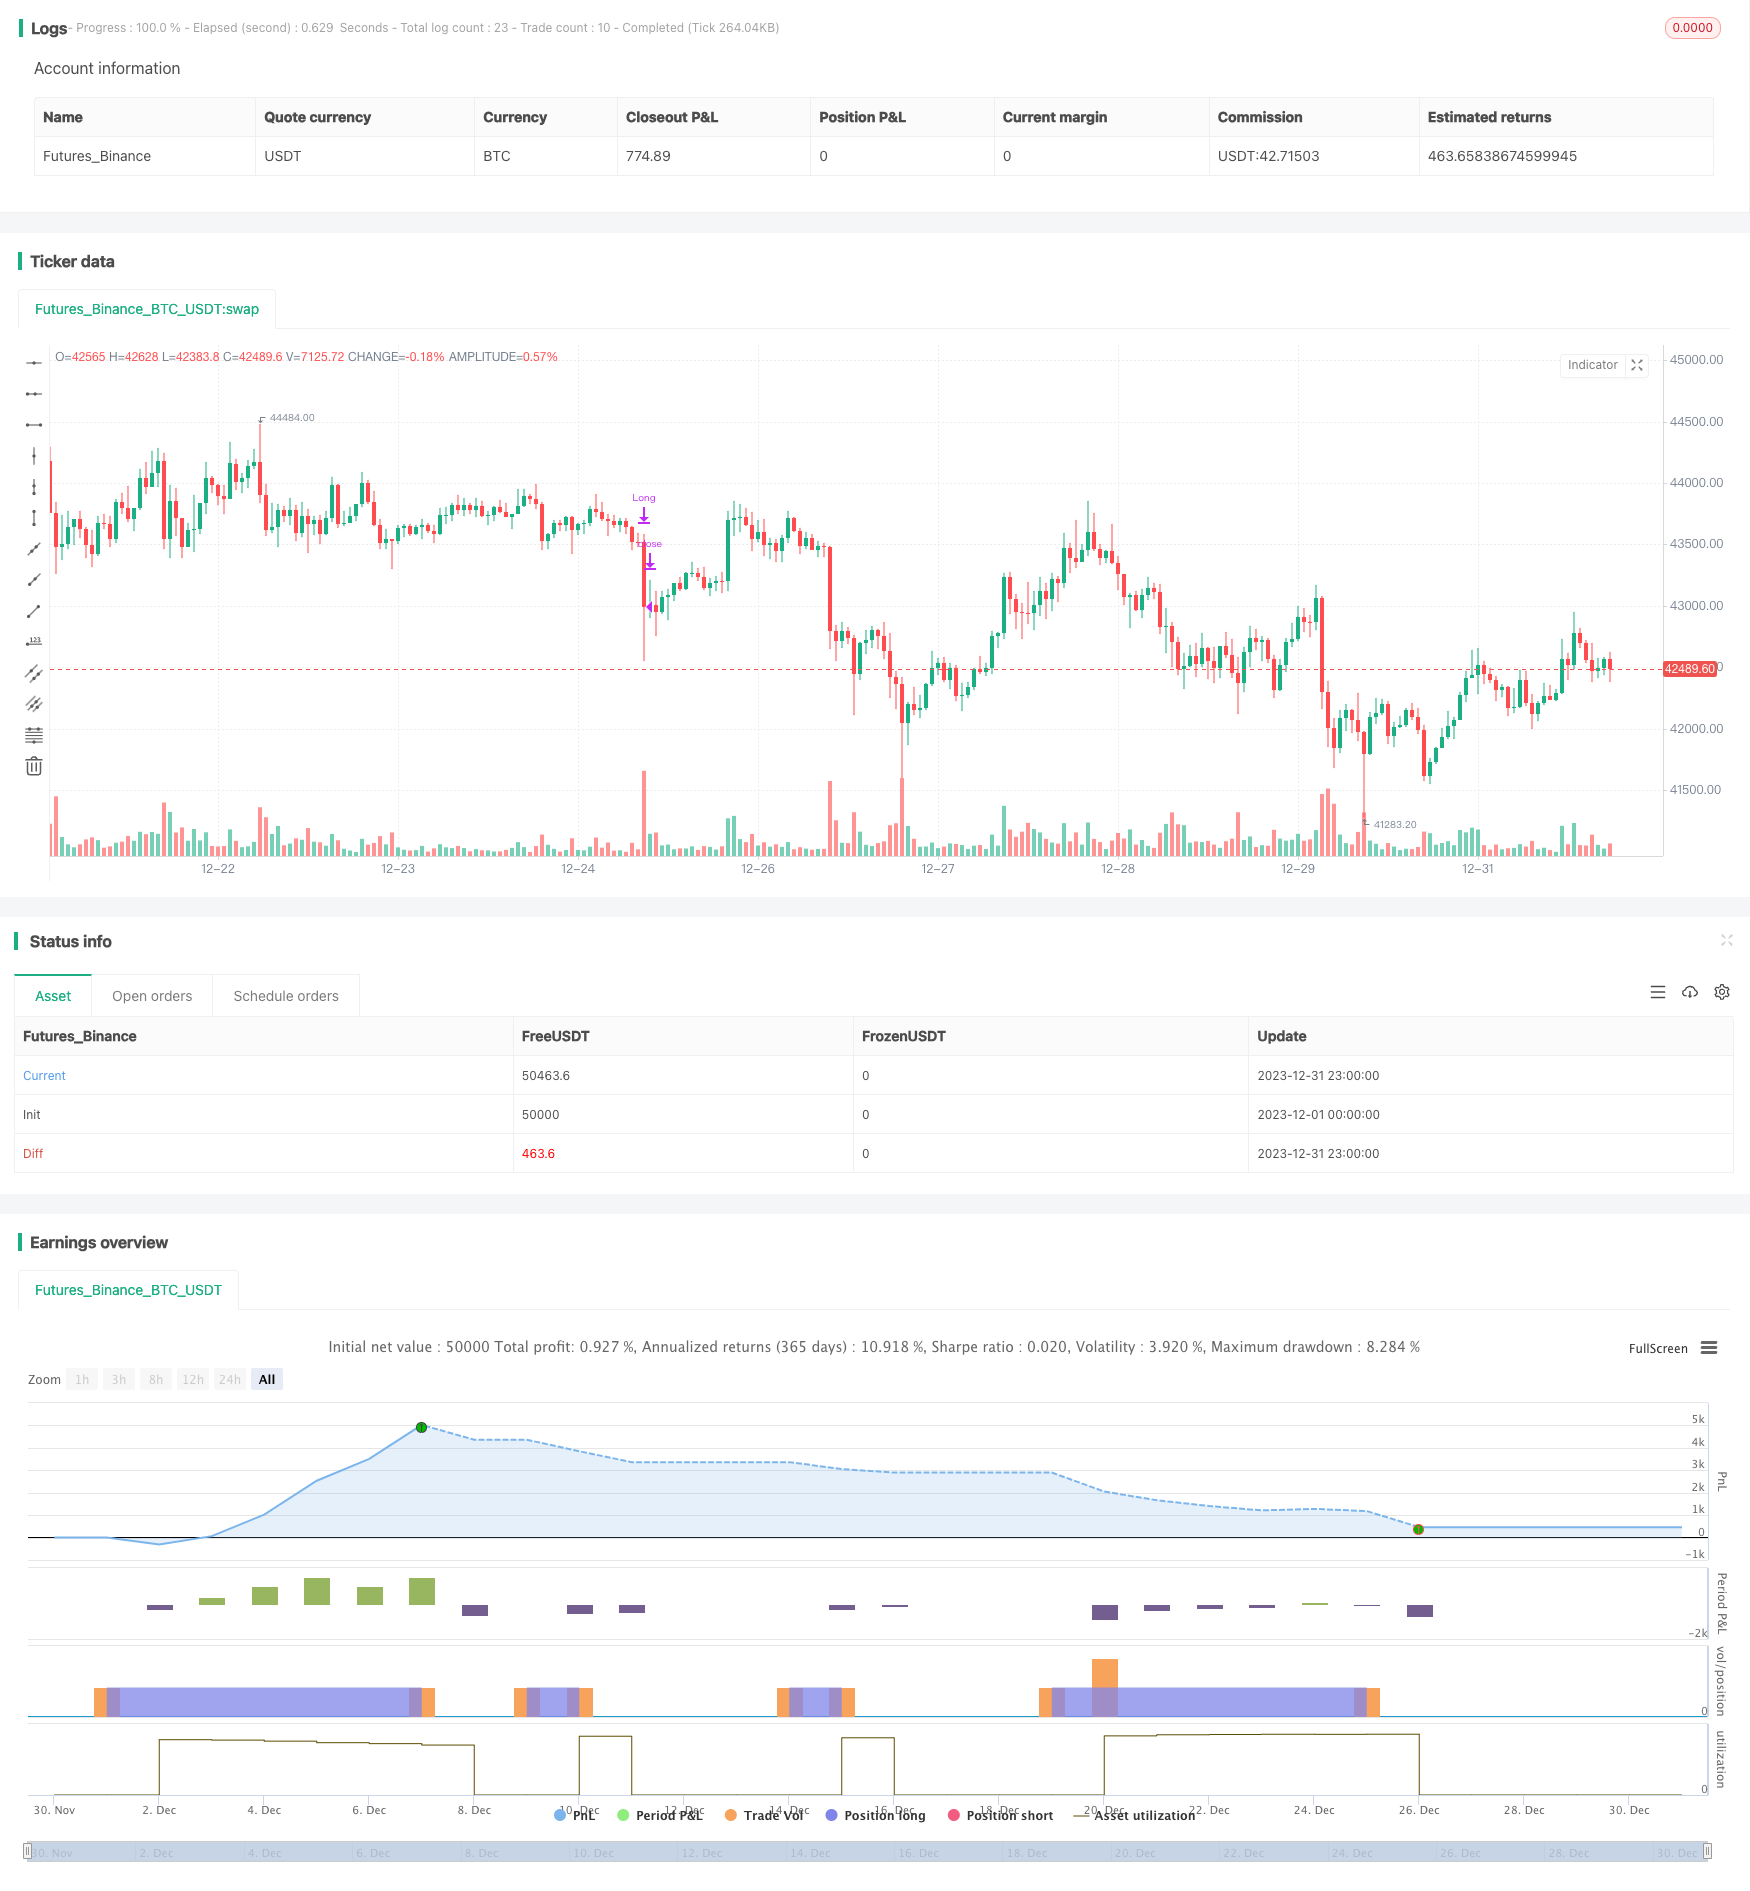
start: 2023-12-01 00:00:00
end: 2023-12-31 23:59:59
period: 1h
basePeriod: 15m
exchanges: [{"eid":"Futures_Binance","currency":"BTC_USDT"}]
*/

//@version=5
strategy("Supertrend, RSI, and EMA Strategy", overlay=true)

// Supertrend Indicator
atrPeriod = input.int(10, "ATR Length", minval=1)
factor = input.float(3.0, "Factor", minval=0.01, step=0.01)
[supertrend, direction] = ta.supertrend(factor, atrPeriod)

// RSI Indicator
rsiLength = input.int(14, "RSI Length")
rsi = ta.rsi(close, rsiLength)

// EMA Indicator
emaLength = 9
ema = ta.ema(close, emaLength)

// Entry Conditions
longCondition1 = close > supertrend and rsi > 70
longCondition2 = close > ema

// Combined Entry Condition
longCondition = longCondition1 and longCondition2
if (longCondition)
    strategy.entry("Long", strategy.long)

// Exit Condition
exitCondition = close < supertrend
if (exitCondition)
    strategy.close("Long")


More