概述
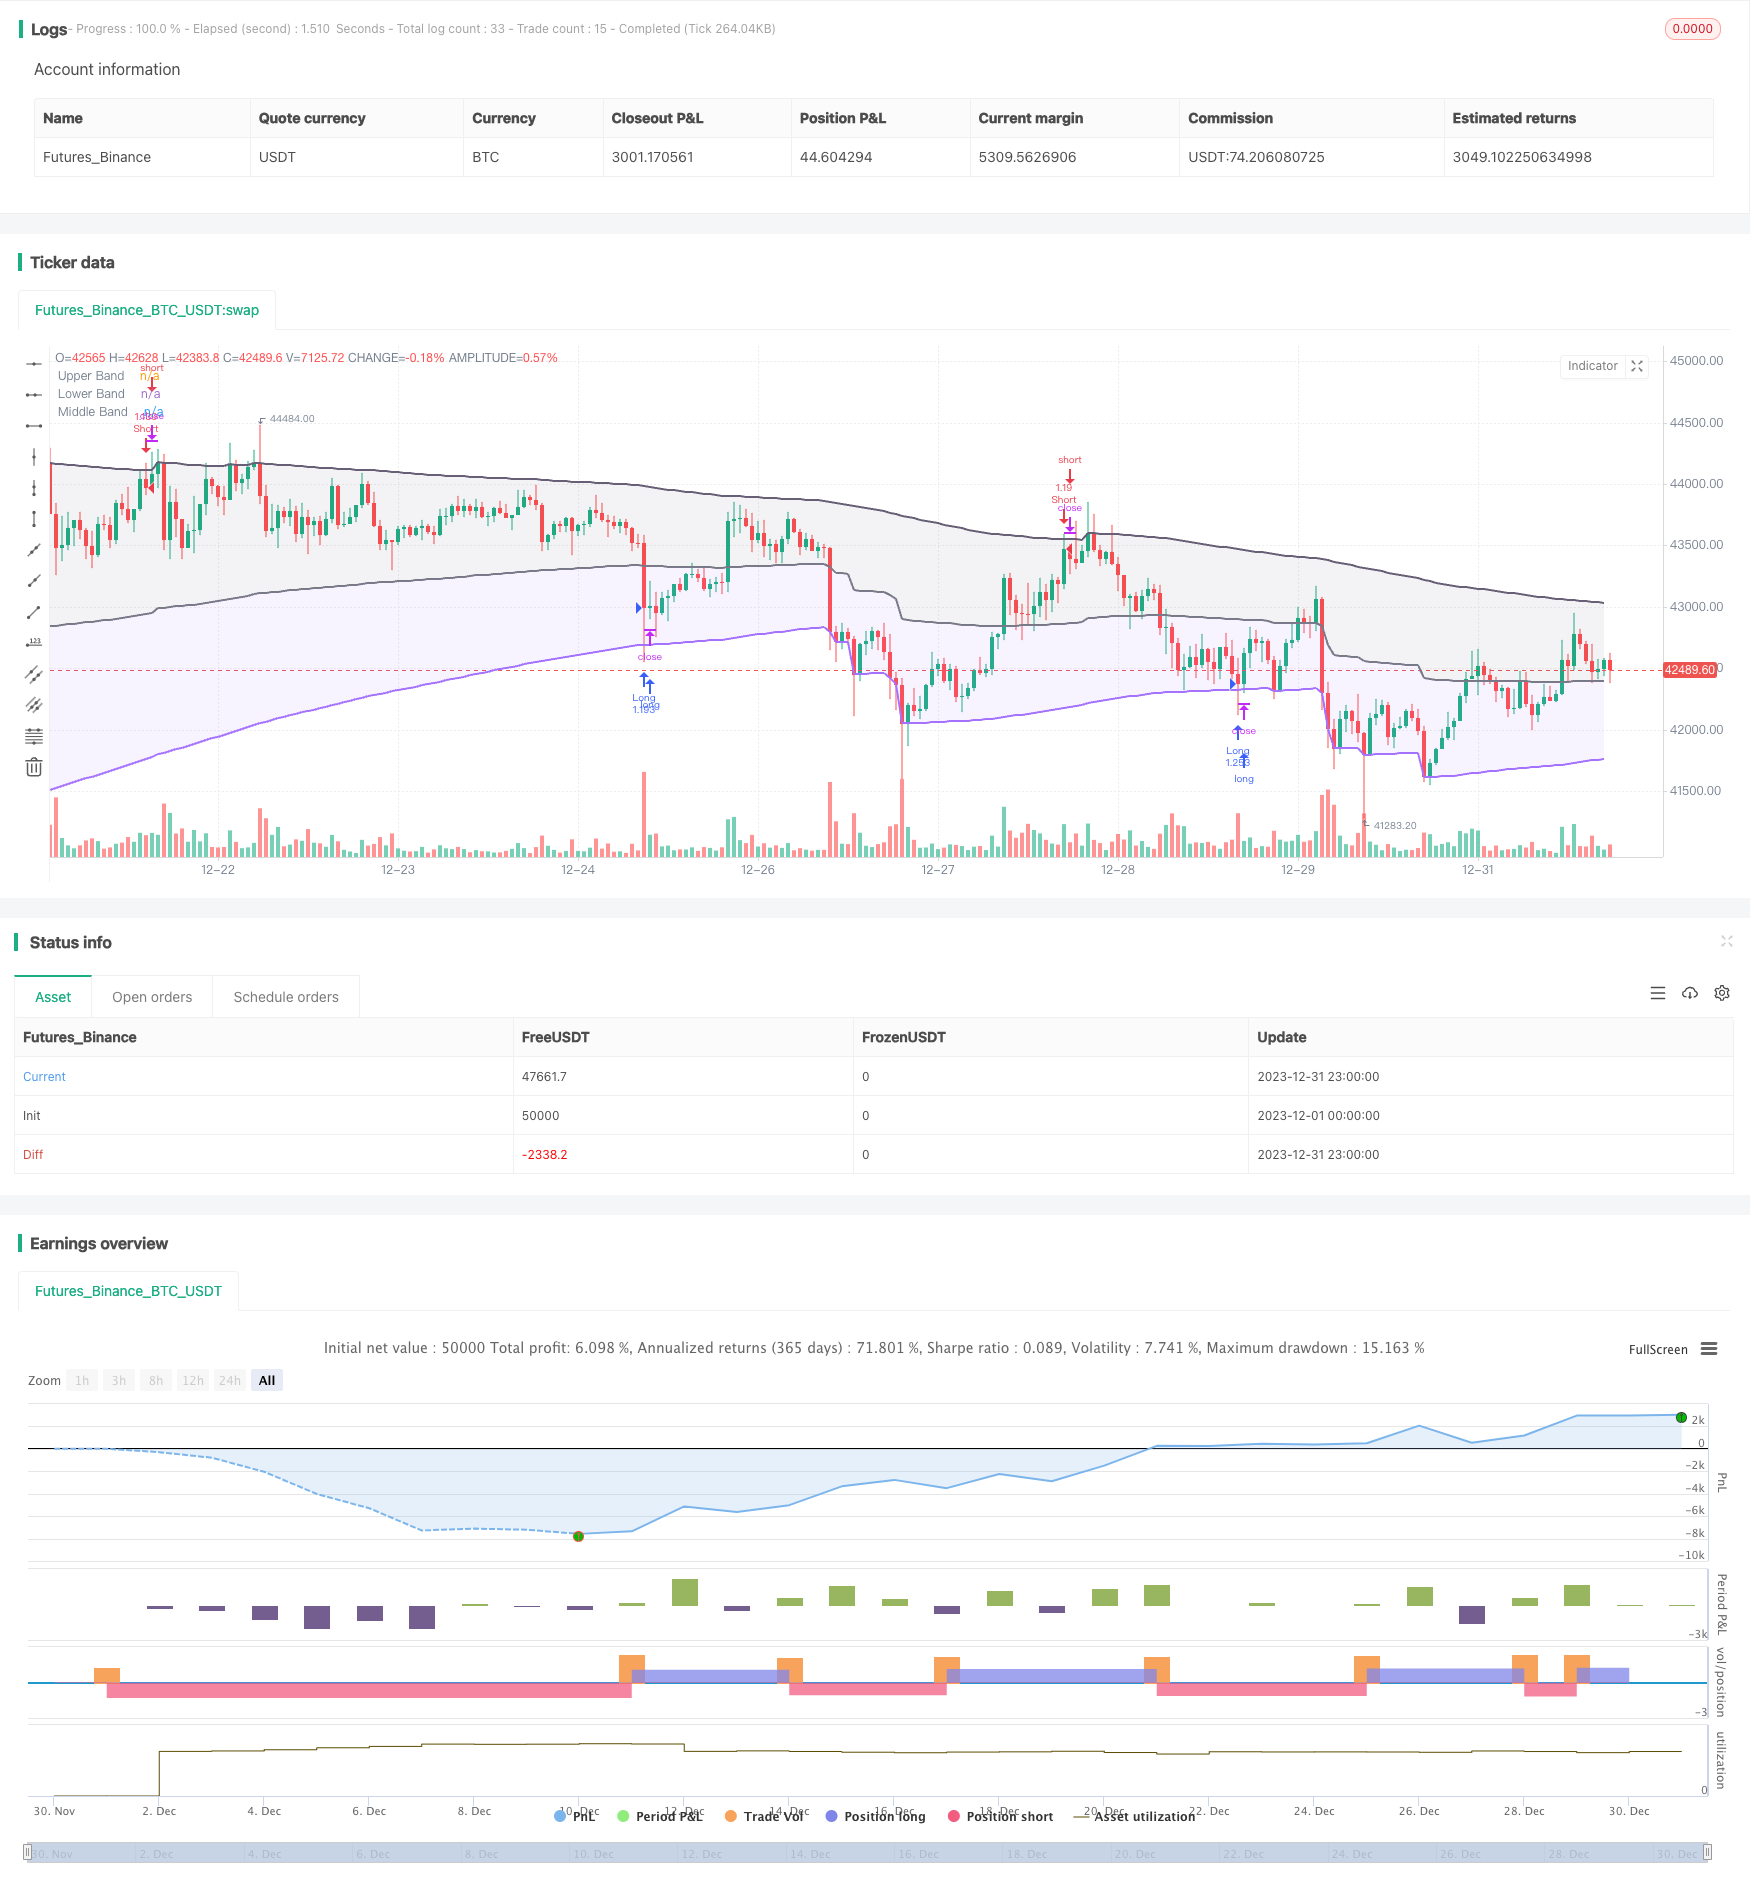
该策略是基于alexgrover开发的递归带指标的趋势跟踪和突破策略。策略利用递归带指标判断价格趋势和关键支持阻力位,结合动量条件过滤假突破,实现低频率但高质量的入场。
策略原理
递归带指标计算
递归带指标由上带、下带和中线组成。指标的计算方式是:
上带 = 最大值(前一根K线的上带,收盘价 + n*波动率)
下带 = 最小值(前一根K线的下带,收盘价 - n*波动率)
中线 = (上带 + 下带)/ 2
其中n是一个缩放系数,波动率可以选择ATR、标准差、均价通道和特殊的RFV方法。长度参数控制指标的敏感度,数值越大,指标越不容易触发。
策略交易规则
策略首先检测下带方向是否持续上行和上带方向是否持续下行,以滤除假突破。
当价格跌破下带时,做多;当价格超过上带时,做空。
此外,策略还设定了止损逻辑。
优势分析
该策略具有如下优势:
- 利用递归框架,指标计算高效,避免重复计算
- 指标参数可调,能适应不同市场环境
- 结合趋势和突破,避免假突破
- 动量条件过滤,确保交易信号质量
风险分析
该策略也存在一些风险:
- 参数设置不当可能导致交易频率过高或信号质量差
- 大周期趋势变化时,可能出现较大亏损
- 极端行情下滑点控制不足可能扩大损失
可以通过优化参数,设立止损,加大滑点来控制这些风险。
优化方向
该策略还可以从以下几个方向进行优化:
- 结合多个周期指标,实现多时间框架交易
- 增加机器学习模块,实现参数自适应优化
- 增加量化关联分析,找到最佳的参数组合
- 利用深度学习预测价格路径,提升信号准确度
总结
该策略总体来说是一个非常实用的高效趋势跟踪策略。它结合递归框架节省计算资源,运用趋势支持阻力判断大趋势方向,增加动量条件过滤假突破,从而确保交易信号质量。在参数调整和风险控制到位的情况下,可以获得较好的效果。值得进一步研究和优化,使之适应更加复杂的市场环境。
策略源码
/*backtest
start: 2023-12-01 00:00:00
end: 2023-12-31 23:59:59
period: 1h
basePeriod: 15m
exchanges: [{"eid":"Futures_Binance","currency":"BTC_USDT"}]
*/

// @version=5
// Original indicator by alexgrover
strategy('Extended Recursive Bands Strategy', overlay=true, commission_type=strategy.commission.percent,commission_value=0.06,default_qty_type =strategy.percent_of_equity,default_qty_value = 100,initial_capital =1000)
length = input.int(260, step=10, title='Length')
src = input(close, title='Source')
method = input.string('Classic', options=['Classic', 'Atr', 'Stdev', 'Ahlr', 'Rfv'], title='Method')
bandDirectionCheck = input.bool(true, title='Bands Hold Direction')
lookback = input(3)
//----
atr = ta.atr(length)
stdev = ta.stdev(src, length)
ahlr = ta.sma(high - low, length)
rfv = 0.
rfv := ta.rising(src, length) or ta.falling(src, length) ? math.abs(ta.change(src)) : rfv[1]
//-----
f(a, b, c) =>
    method == a ? b : c
v(x) =>
    f('Atr', atr, f('Stdev', stdev, f('Ahlr', ahlr, f('Rfv', rfv, x))))
//----
sc = 2 / (length + 1)
a = 0.
a := math.max(nz(a[1], src), src) - sc * v(math.abs(src - nz(a[1], src)))
b = 0.
b := math.min(nz(b[1], src), src) + sc * v(math.abs(src - nz(b[1], src)))
c = (a+b)/2

// Colors
beColor = #675F76
buColor = #a472ff

// Plots
pA = plot(a, color=color.new(beColor, 0), linewidth=2, title='Upper Band')
pB = plot(b, color=color.new(buColor, 0), linewidth=2, title='Lower Band')
pC = plot(c, color=color.rgb(120,123,134,0), linewidth=2, title='Middle Band')
fill(pC, pA, color=color.new(beColor,90))
fill(pC, pB, color=color.new(buColor,90))

// Band keeping direction
// By Adulari
longc = 0
shortc = 0
for i = 0 to lookback-1
    if b[i] > b[i+1]
        longc:=longc+1
    if a[i] < a[i+1]
        shortc:=shortc+1
bhdLong = if bandDirectionCheck
    longc==lookback
else
    true
bhdShort = if bandDirectionCheck
    shortc==lookback
else
    true

// Strategy
if b>=low and bhdLong
    strategy.entry(id='Long',direction=strategy.long)
if high>=a and bhdShort
    strategy.entry(id='Short',direction=strategy.short)

// TP at middle line
//if low<=c and strategy.position_size<0 and strategy.position_avg_price>close
    //strategy.exit(id="Short",limit=close)
//if high>=c and strategy.position_size>0 and strategy.position_avg_price<close
    //strategy.exit(id="Long",limit=close)