Qullamaggie Breakout Tracking Strategy

Overview
The main idea of this strategy is to identify the trend direction on a larger timeframe and find breakout points to enter on a smaller timeframe. The stop loss exit then tracks the moving average on the larger timeframe.
Strategy Principle
This strategy mainly relies on three indicators for judgment.
First, calculate a longer cycle (such as daily) X-day simple moving average. Allow buying only when the price is above this moving average. This can be used to determine the overall trend direction and avoid trading oscillating periods.
Second, calculate the highest price Swing High in a shorter cycle (such as 5 days). When the price breaks through this highest price, a buy signal is triggered. The lb lookback period parameter is used here to find suitable breakout points.
Third, establish a stop loss line. After entering the position, the stop loss line is locked at the lowest price a certain period lbStop away from the most recent low point. At the same time, set a moving average line (such as 10-day EMA on the daily) as an exit mechanism. Exit the position when the price is below this moving average line.
The strategy also sets the ATR value to avoid buying overextended points. There are also other auxiliary conditions such as backtest time range.
The interaction judgment of the above three indicators forms the core logic of this strategy.
Advantage Analysis
As a breakout tracking strategy, it has the following advantages:
-
Use two timeframes to avoid being trapped in fake breakouts in oscillating markets. The longer timeframe determines the overall trend, and the shorter timeframe finds specific entry points.
-
Use the breakout points formed by swing high. This type of breakout has certain inertia and is easy to form tracking. The lb lookback period parameter can also be adjusted to find truly effective breakouts.
-
The stop loss method is relatively strict, tracking the most recent low point with a certain buffer distance to avoid being scraped.
-
Use the moving average as an exit mechanism to flexibly take profits according to market conditions.
-
The ATR indicator avoids the risk of over-leverage.
-
Different parameter combinations can be set for testing, with large optimization space.
Risk Analysis
The strategy also has some risks:
-
When the price oscillates up and down around the moving average line, it is easy to switch back and forth between entering and exiting positions. There is a higher commission risk.
-
When the break-in point is close to the moving average line, there is a relatively large pullback risk. This is an inherent feature of the strategy.
-
When there is no obvious trend in the market, the holding time may be too long, facing time risk.
-
The ATR parameter needs to be set reasonably. If ATR is too small, the filtering effect is weak. If it is too large, the entry opportunities will decrease.
-
Need to test the impact of different lb parameters on the results. Excessive large parameters may miss some opportunities, while too small parameters may identify false breakouts.
Risk Mitigation:
- Adjust moving average parameters appropriately to increase filtering capability.
- Optimize ATR parameters, supplemented by visual judgment.
- Adjust the lb lookback period to find the optimal parameters.
- Suspend trading during oscillating markets.
Optimization Directions
The strategy can also be optimized in the following dimensions:
-
Test different combinations of moving average parameters to find the optimal parameters.
-
Try different ATR parameter settings to balance entry opportunities and risk control.
-
Optimize the lb lookback period parameter to identify more efficient breakouts.
-
Try to build a dynamic stop loss based on volatility and drawdown to control risk.
-
Incorporate other factors such as trading volume to determine the effectiveness of breakouts.
-
Develop/',</,>< and other methods to find extreme points as references.
-
Try Machine Learning to train parameters for optimal parameters
Summary
Overall, this is a typical breakout tracking strategy. Judging by dual timeframes, using Swing High to identify entry timing, and using stop loss line and moving average double insurance exit mechanisms form a complete logical system. The risk and return characteristics of this strategy are clear, suitable for medium and long term tracking investors. Although there are certain risks, they can be reduced by optimizing parameters and rules. The strategy has great room for improvement. Incorporating more indicators may further enhance the strategy effect.
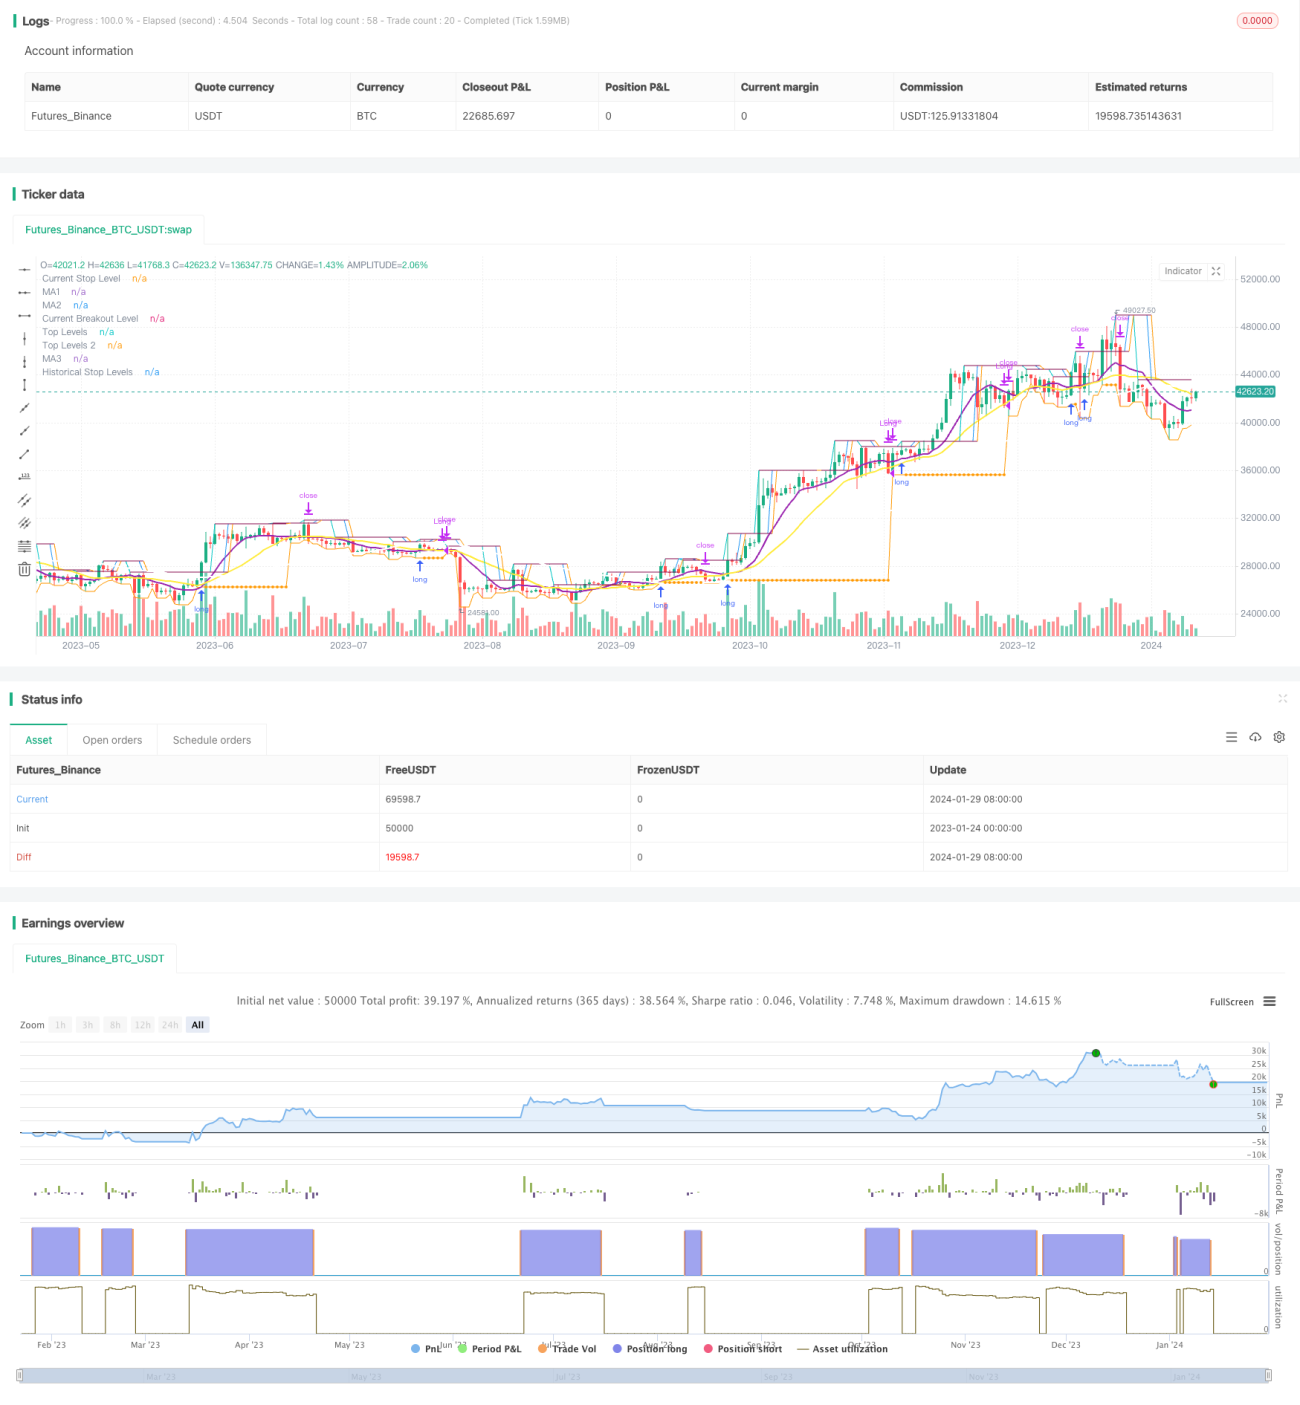
/*backtest
start: 2023-01-24 00:00:00
end: 2024-01-30 00:00:00
period: 1d
basePeriod: 1h
exchanges: [{"eid":"Futures_Binance","currency":"BTC_USDT"}]
*/

// This source code is subject to the terms of the Mozilla Public License 2.0 at https://mozilla.org/MPL/2.0/
// © millerrh

// The intent of this strategy is to buy breakouts with a tight stop on smaller timeframes in the direction of the longer term trend.- 1