概述
双ATR尾随止损策略是基于平均真实波幅(ATR)指标的一个短线交易策略。该策略同时设置快速ATR线和慢速ATR线两个止损线,根据两条止损线的交叉情况判断入场和出场。策略简单易懂,响应迅速,适合高波动的市场。
策略原理
该策略主要利用ATR指标来设置两条止损线。一条是快速ATR线,ATR周期短,乘数小,反应迅速;另一条是慢速ATR线,ATR周期长,乘数大,起到过滤的作用。当快速ATR线上穿慢速ATR线时产生买入信号;当快速ATR线下穿慢速ATR线时产生卖出信号。这样通过两条ATR线交叉决定入场出场,可以有效控制止损。
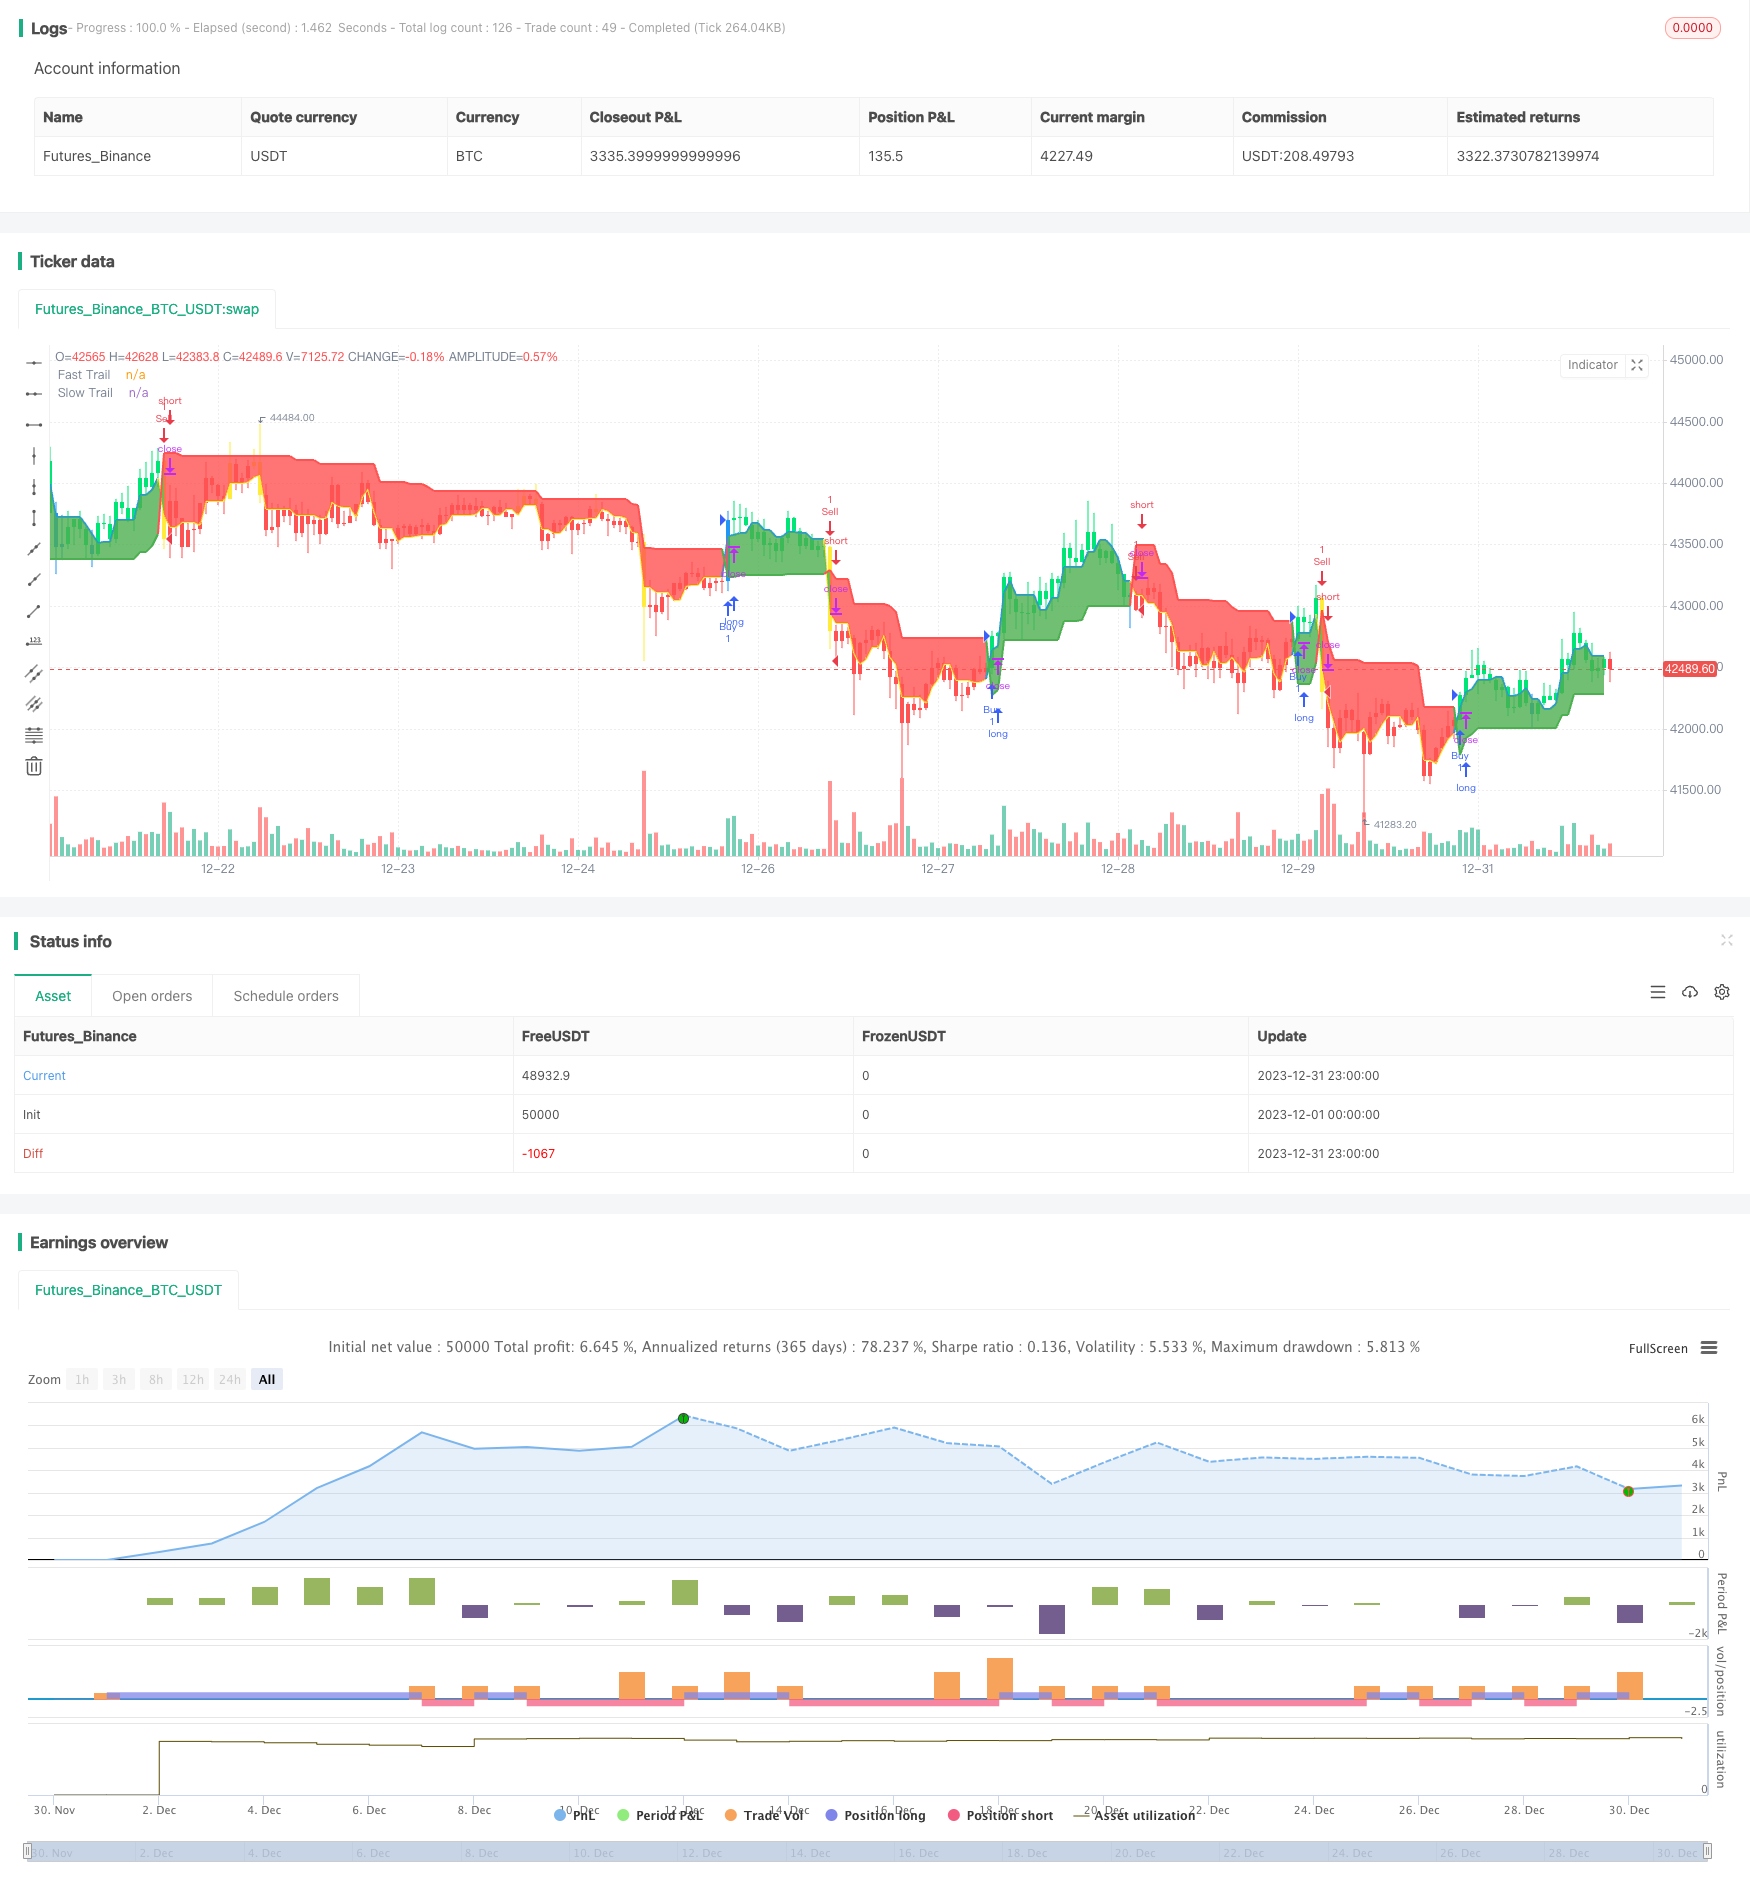
具体操作逻辑是:计算快速ATR线和慢速ATR线;快速线价格高于慢速线则用快速线尾随止损,否则用慢速线尾随止损。Kline颜色表示目前使用的止损线,绿色和蓝色表示用快速线止损,红色和黄色表示用慢速线止损。当市场价格触碰到止损线则出场。
优势分析
双ATR尾随止损策略具有以下优势:
- 操作逻辑简单清晰,容易理解实现。
- 快速响应市场变化,适合高波动的市场。
- 双ATR止损控制风险,有效止损。
- ATR指标参数化,可以调整止损幅度。
- 可视化的Kline颜色清晰表示止损情况。
风险分析
该策略也存在一些风险:
- 容易出现过频交易的情况。
- ATR指标对曲线拟合性差,可能出现放大损失。
- 无法有效过滤横盘和趋势两个市场阶段。
可以通过优化ATR周期,调整ATR乘数,结合其他指标过滤等方法来减小这些风险。
优化方向
双ATR尾随止损策略可进一步优化的方向包括:
- 优化ATR参数,调整止损幅度。
- 增加过滤指标,避免无效交易。例如增加均线指标判断趋势。
- 增加开仓条件,避免误交易。例如增加交易量能量指标。
- 增加持仓时间 exits,避免过于频繁交易。
总结
双ATR尾随止损策略整体易于理解实现,特别适合高波动率的场景,可以有效进行风险控制。优化空间也较大,可通过参数调整、加入过滤器等方法进行提升。是一种值得推荐的短线策略。
策略源码
/*backtest
start: 2023-12-01 00:00:00
end: 2023-12-31 23:59:59
period: 1h
basePeriod: 15m
exchanges: [{"eid":"Futures_Binance","currency":"BTC_USDT"}]
*/

// This source code is subject to the terms of the Mozilla Public License 2.0 at https://mozilla.org/MPL/2.0/
// © ceyhun

//@version=4
strategy("ATR Trailing Stop Strategy by ceyhun", overlay=true)

/////////notes////////////////////////////////////////
// This is based on the ATR trailing stop indicator //
// width addition of two levels of stops and        //
// different interpretation.                        //
// This is a fast-reacting system and is better     //
// suited for higher volatility markets             //
//////////////////////////////////////////////////////

SC = input(close, "Source", input.source)

// Fast Trail //
AP1 = input(5, "Fast ATR period", input.integer)  // ATR Period
AF1 = input(0.5, "Fast ATR multiplier", input.float)  // ATR Factor
SL1 = AF1 * atr(AP1)  // Stop Loss
Trail1 = 0.0
Trail1 := iff(SC > nz(Trail1[1], 0) and SC[1] > nz(Trail1[1], 0), max(nz(Trail1[1], 0), SC - SL1), iff(SC < nz(Trail1[1], 0) and SC[1] < nz(Trail1[1], 0), min(nz(Trail1[1], 0), SC + SL1), iff(SC > nz(Trail1[1], 0), SC - SL1, SC + SL1)))

// Slow Trail //
AP2 = input(10, "Slow ATR perod", input.integer)  // ATR Period
AF2 = input(2, "Slow ATR multiplier", input.float)  // ATR Factor
SL2 = AF2 * atr(AP2)  // Stop Loss
Trail2 = 0.0
Trail2 := iff(SC > nz(Trail2[1], 0) and SC[1] > nz(Trail2[1], 0), max(nz(Trail2[1], 0), SC - SL2), iff(SC < nz(Trail2[1], 0) and SC[1] < nz(Trail2[1], 0), min(nz(Trail2[1], 0), SC + SL2), iff(SC > nz(Trail2[1], 0), SC - SL2, SC + SL2)))

// Bar color for trade signal //
Green = Trail1 > Trail2 and close > Trail2 and low > Trail2
Blue = Trail1 > Trail2 and close > Trail2 and low < Trail2
Red = Trail2 > Trail1 and close < Trail2 and high < Trail2
Yellow = Trail2 > Trail1 and close < Trail2 and high > Trail2

// Signals //
Bull = barssince(Green) < barssince(Red)
Bear = barssince(Red) < barssince(Green)

Buy = crossover(Trail1, Trail2)
Sell = crossunder(Trail1, Trail2)

TS1 = plot(Trail1, "Fast Trail", style=plot.style_line,color=Trail1 > Trail2 ? color.blue : color.yellow, linewidth=2)
TS2 = plot(Trail2, "Slow Trail", style=plot.style_line,color=Trail1 > Trail2 ? color.green : color.red, linewidth=2)
fill(TS1, TS2, Bull ? color.green : color.red, transp=90)

plotcolor = input(true, "Paint color on chart", input.bool)

bcl = iff(plotcolor == 1, Blue ? color.blue : Green ? color.lime : Yellow ? color.yellow : Red ? color.red : color.white, na)
barcolor(bcl)

if Buy
    strategy.entry("Buy", strategy.long, comment="Buy")

if Sell
    strategy.entry("Sell", strategy.short, comment="Sell")