概述
该策略结合了枢轴点指标和平均真实波动带指标,实现了一个多时间框架的趋势跟踪系统。它可以捕捉中间周期的趋势,同时利用枢轴点判断长期支撑阻力,实现更好的进出场。
策略原理
该策略主要基于两种指标:
枢轴点指标:通过计算一定周期的最高价、最低价、收盘价的平均值,确定上枢轴点和下枢轴点。枢轴点可作为关键支撑阻力区域。
平均真实波动带:计算一定周期的平均真实波动幅度,并以中轴线上下移出通道,通道上沿和下沿可作为动态止损线。
策略的具体交易逻辑是:
当价格突破平均真实波动带通道时,采取与突破方向一致的做多或做空方向。当价格重新回到通道内时,平仓。同时,当价格突破上枢轴点时,采取做多姿态;当价格突破下枢轴点时,采取做空姿态。
该策略还引入了枢轴点的中线概念。当止盈突破中线时,有可能选择收获一半利润,控制风险。
优势分析
该策略具有以下几个优势:
多时间框架设计,中长期 Determines 大趋势,短期 Determines 具体入场。
枢轴点中线可作为风险控制选择,收获一半利润,确保盈利。
平均真实波动带通道提供清晰止损位置。
策略参数较少,容易优化找到最佳参数组合。
最大限度回避了假突破的风险。
风险分析
该策略也存在一些风险:
市场剧烈波动时,止损风险较大。
行情震荡时,中轴线容易形成压力,可能频繁止损。
参数选择不当可能导致交易频繁或者交易次数过少。
近期价格突破枢轴点,有可能是假突破。
优化方向
该策略可以从以下几个方向进行优化:
结合更多指标过滤入场信号,避免假突破。例如结合量能指标、布林带指标等。
优化枢轴点和平均真实波动带的周期参数,找到最佳参数组合。
在枢轴点中线附近设立缓冲区,避免中线被频繁触发。
加入适当的趋势过滤,确保大趋势同方向操作。
总结
该策略总体来说是一个非常实用的趋势跟踪策略。它解决了大多趋势系统存在的止损困难问题,实现了风险可控的趋势交易,是一个非常值得推荐的策略。后续通过适当优化和改进,该策略的效果还可进一步提升。
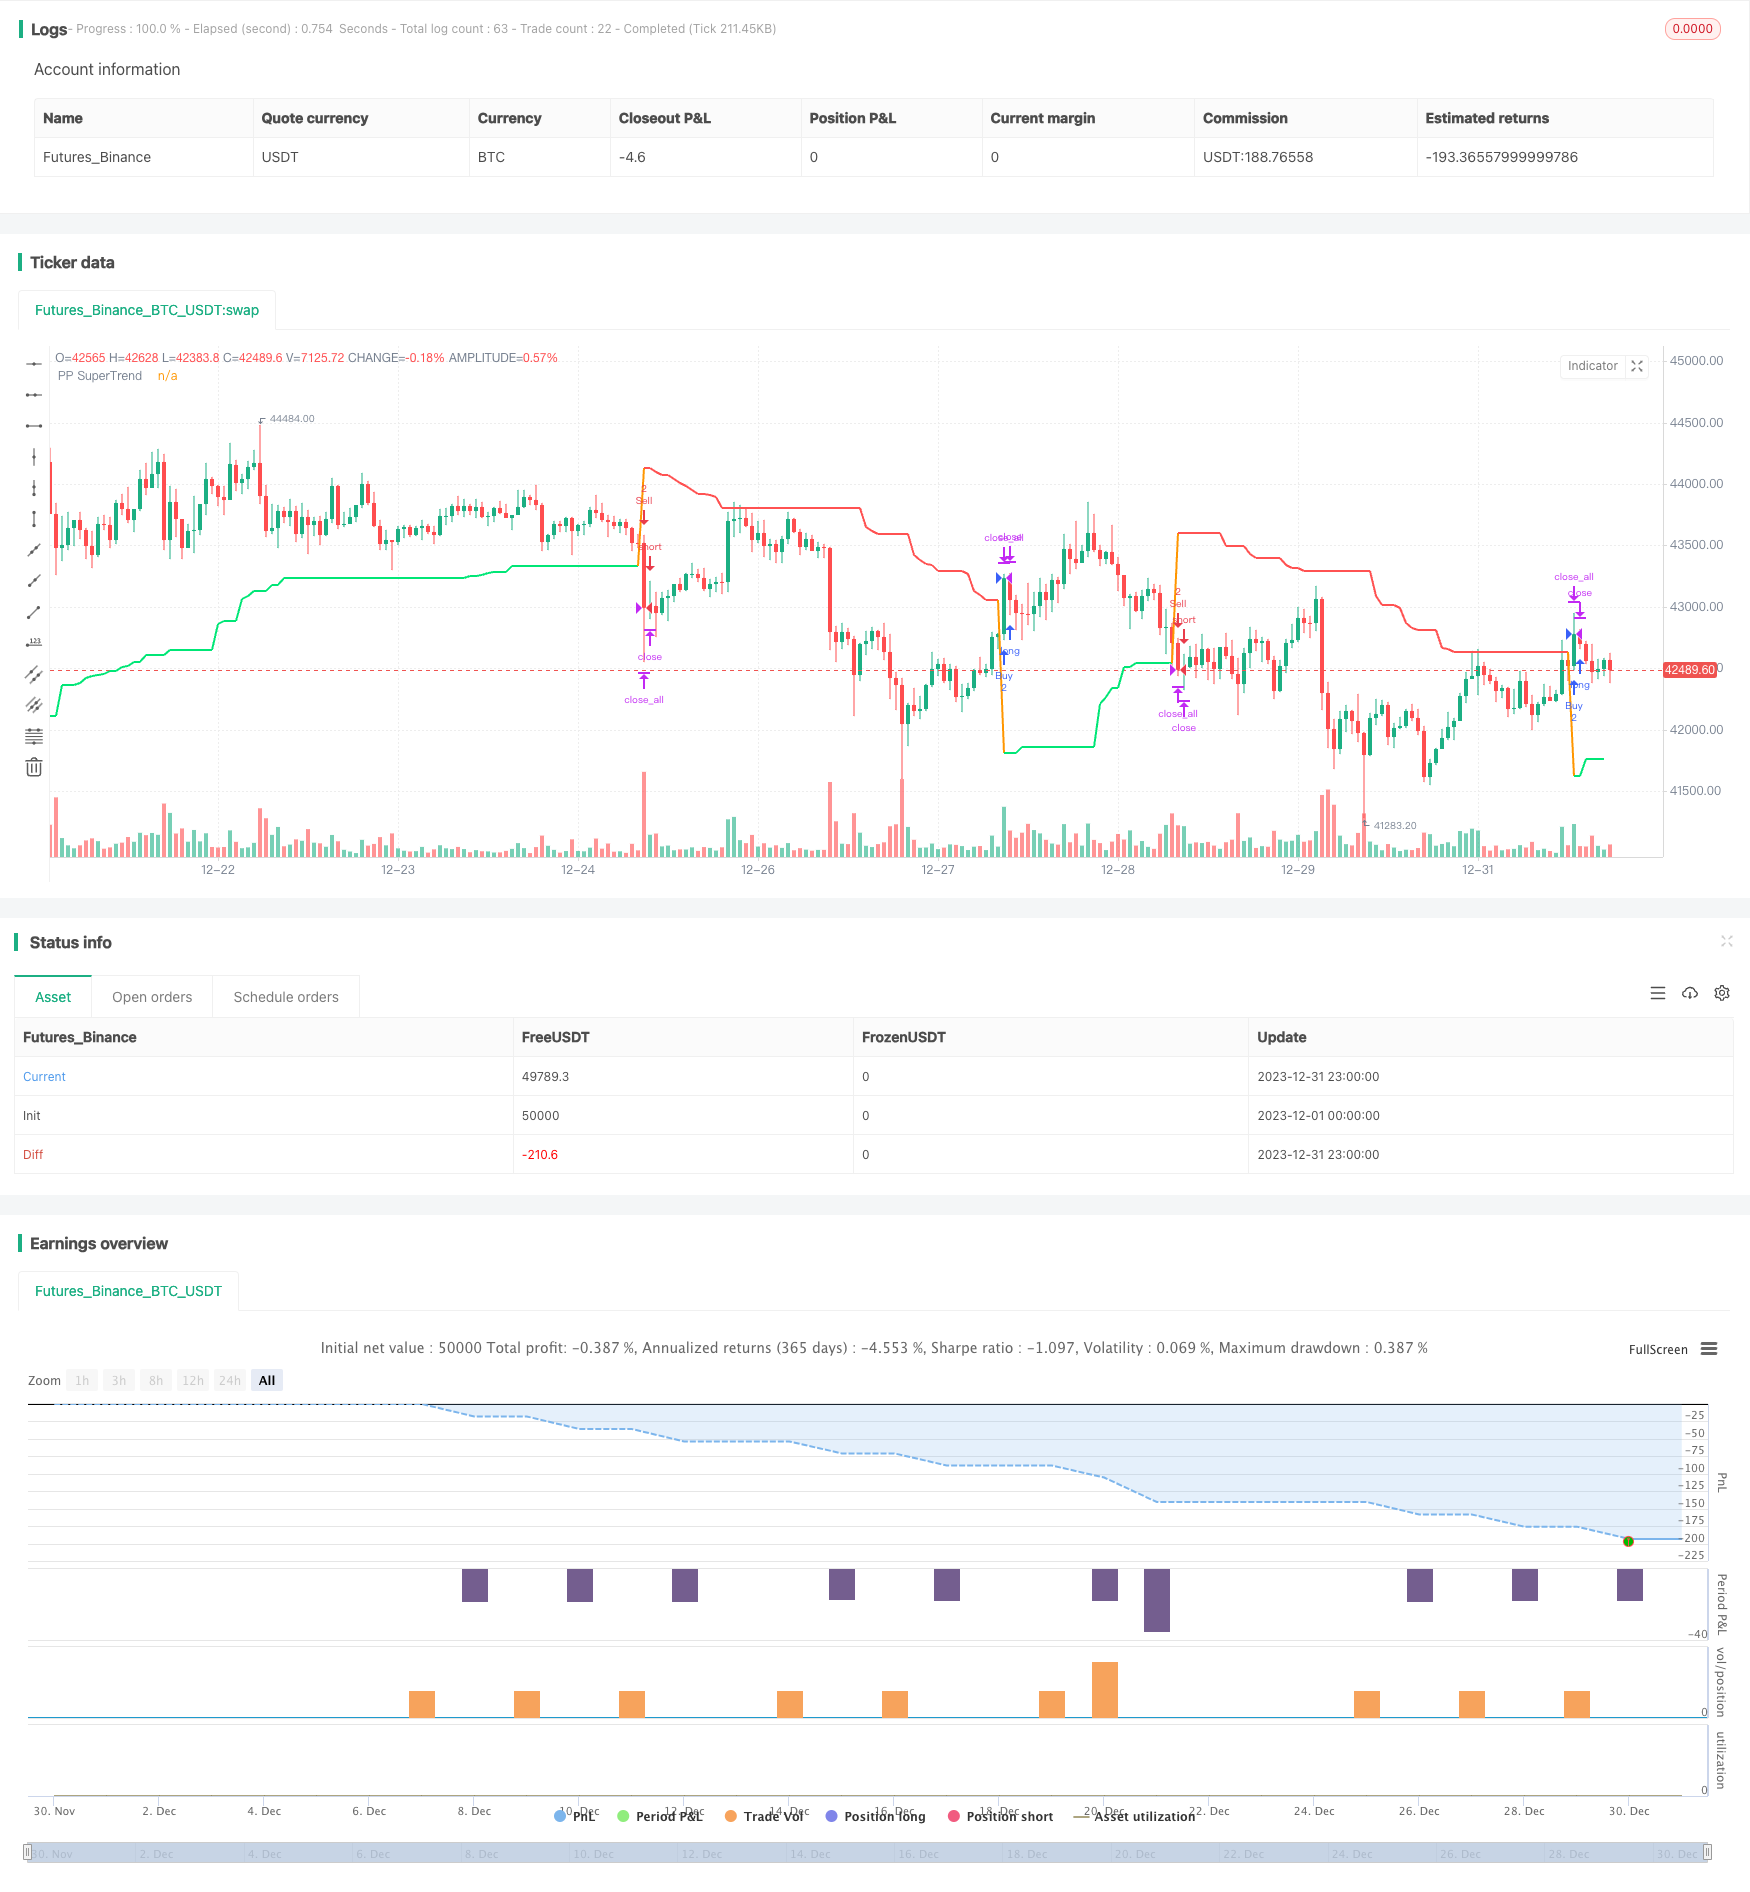
/*backtest
start: 2023-12-01 00:00:00
end: 2023-12-31 23:59:59
period: 1h
basePeriod: 15m
exchanges: [{"eid":"Futures_Binance","currency":"BTC_USDT"}]
*/

// This source code is subject to the terms of the Mozilla Public License 2.0 at https://mozilla.org/MPL/2.0/
// © LonesomeTheBlue

//@version=4
strategy("Pivot Point SuperTrend [Backtest]", overlay = true)
prd = input(defval = 2, title="Pivot Point Period", minval = 1, maxval = 50)
Factor=input(defval = 3, title = "ATR Factor", minval = 1, step = 0.1)
Pd=input(defval = 10, title = "ATR Period", minval=1)
usecenter = input(defval = false, title="Use Center Line to Close Entry for 50%")
showpivot = input(defval = false, title="Show Pivot Points")
showcl = input(defval = false, title="Show PP Center Line")


float ph = na
float pl = na
ph := pivothigh(prd, prd)
pl := pivotlow(prd, prd)

plotshape(ph and showpivot, text="H",  style=shape.labeldown, color=na, textcolor=color.red, location=location.abovebar, transp=0, offset = -prd)
plotshape(pl and showpivot, text="L",  style=shape.labeldown, color=na, textcolor=color.lime, location=location.belowbar, transp=0, offset = -prd)

float center = na
center := center[1]
float lastpp = ph ? ph : pl ? pl : na
if lastpp
    if na(center)
        center := lastpp
    else
        center := (center * 2 + lastpp) / 3

Up = center - (Factor * atr(Pd))
Dn = center + (Factor * atr(Pd))

float TUp = na
float TDown = na
Trend = 0
TUp := close[1] > TUp[1] ? max(Up, TUp[1]) : Up
TDown := close[1] < TDown[1] ? min(Dn, TDown[1]) : Dn
Trend := close > TDown[1] ? 1: close < TUp[1]? -1: nz(Trend[1], 1)
Trailingsl = Trend == 1 ? TUp : TDown

linecolor = Trend == 1 and nz(Trend[1]) == 1 ? color.lime : Trend == -1 and nz(Trend[1]) == -1 ? color.red : na
plot(Trailingsl, color = linecolor ,  linewidth = 2, title = "PP SuperTrend")

plot(showcl ? center : na, color = showcl ? center < hl2 ? color.blue : color.red : na, transp = 0)

bsignal = Trend == 1 and Trend[1] == -1
ssignal = Trend == -1 and Trend[1] == 1

if bsignal
    strategy.entry("Buy", true, 2, comment = "Buy")
if ssignal
    strategy.entry("Sell", false, 2, comment = "Sell")

if strategy.position_size == 2 and center > hl2 and usecenter
    strategy.close("Buy", qty_percent = 50, comment = "close buy entry for 50%")
if strategy.position_size == -2 and center < hl2 and usecenter
    strategy.close("Sell", qty_percent = 50, comment = "close sell entry for 50%")

if change(Trend)
    strategy.close_all()