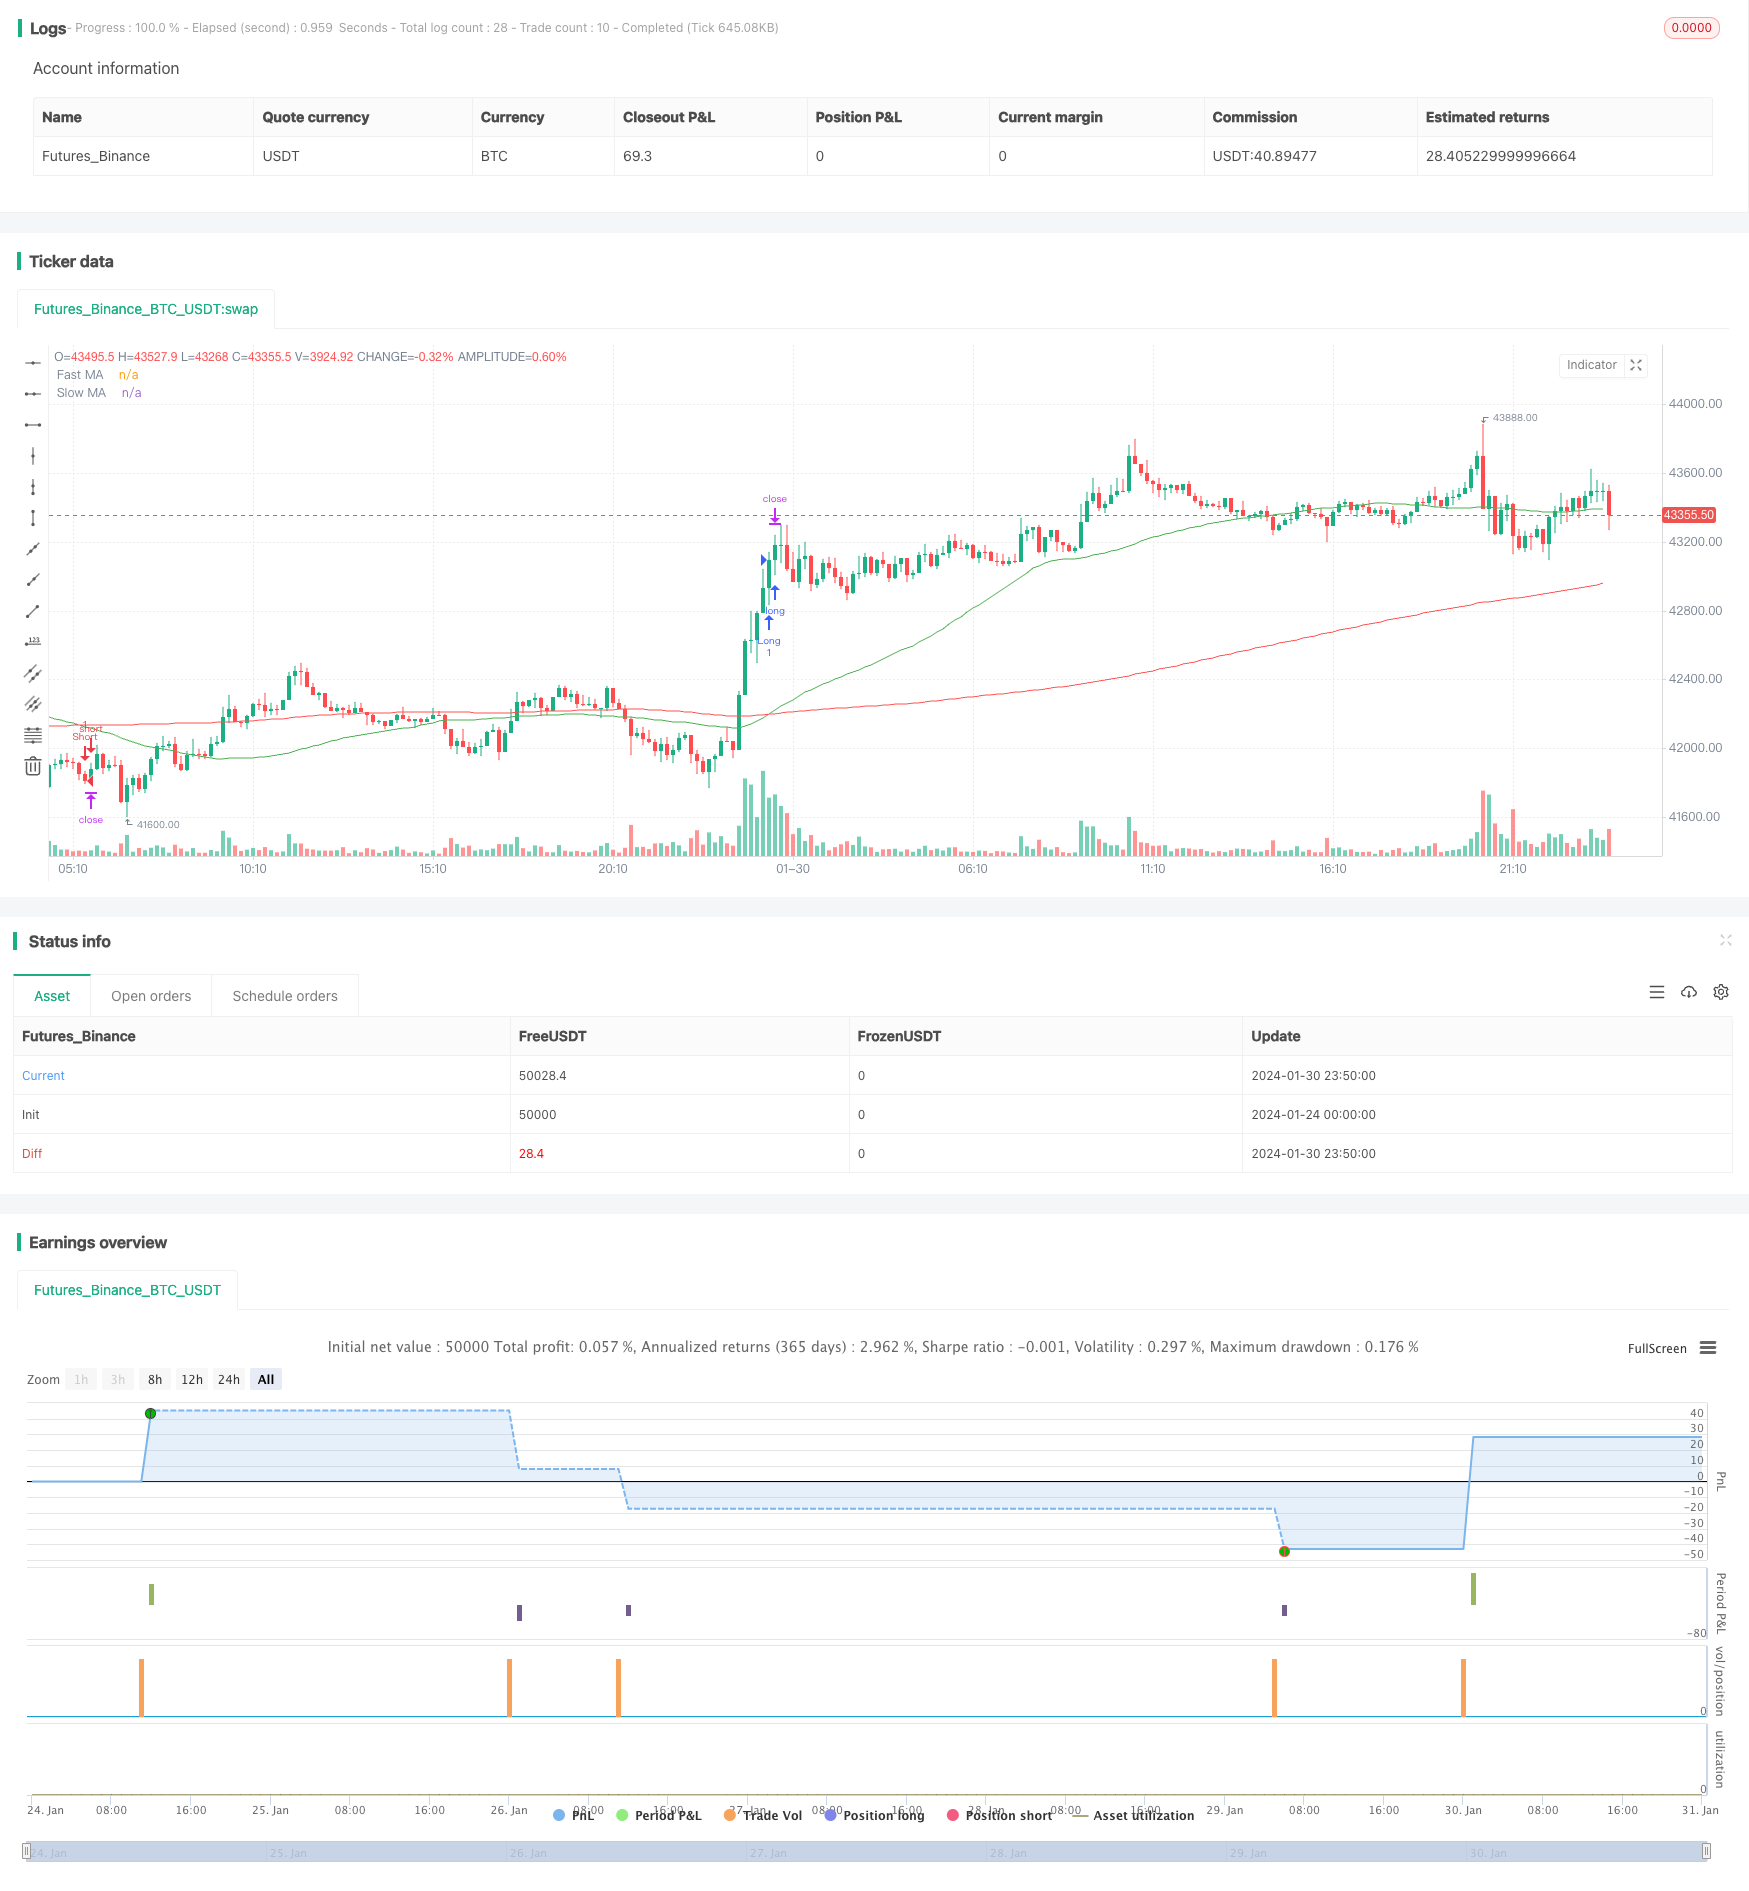
Moving Average Trend Following Strategy

Author: ChaoZhang, Date: 2024-02-01 10:18:53
Tags:

img

Overview

This strategy judges the market trend direction by calculating the fast moving average (Fast MA) and slow moving average (Slow MA) and making comparisons to implement long or short positions along the trend. When the fast MA crosses over the slow MA, go long. When the fast MA crosses below the slow MA, go short. Meanwhile, stop loss and take profit are set to control risks.

Principles

The core logic of this strategy is based on the golden cross and dead cross of moving averages. Moving averages can reflect changes in the average market price very well. The fast average has a shorter period and can respond to price changes quickly. The slow average has a longer period and represents the broader market trend direction. When the fast MA crosses over the slow MA, it indicates the market is starting a bullish trend. When the fast MA crosses below the slow MA, it indicates the market is starting a bearish trend.

Specifically, this strategy calculates the 50-period fast MA and 200-period slow MA, respectively. On each candlestick’s close, it judges if the fast MA has crossed over or below the slow MA. If there is a cross-over (the yellow line crossing over the red line), it enters a long position at next candlestick’s open. If there is a cross-below (the yellow line crossing below the red line), it enters a short position at next candlestick’s open.

After entering positions, TrailStop will be used to track the stop loss and lock in profits. In addition, the stop loss and take profit are set based on the ATR values.

Advantages

This is a typical trend-following strategy with the following advantages:

  1. Using moving averages to determine trend direction has high accuracy and good win rate
  2. Adopting fast and slow moving average combos can filter market noise effectively and capture major trends
  3. Setting stop loss and take profit can control single loss and increase profit probability
  4. Backtest results are good, with acceptable maximum drawdown and Sharpe ratio
  5. The strategy logic is simple and easy to understand, the parameters are flexible for adjustment, suitable for average traders

Risks

There are also some risks for this strategy:

  1. Signals generated by moving averages may lag and be impacted by false breakouts when extreme market volatility happens
  2. Improper setting of stop loss or take profit may lead to losses or missing profits
  3. Overly relying on parameter settings, improper parameters will greatly affect strategy performance
  4. It’s unable to perfectly avoid small losses from price probes and pullbacks
  5. It does not consider the impact of fundamentals and significant news events on markets

Solutions:

  1. Reasonably evaluate and set the moving average cycle parameters
  2. Adopt adaptive stop loss and take profit to avoid manual setting errors
  3. Optimize parameters through complexity analysis and backtest
  4. Expand stop loss range appropriately and increase position sizing
  5. Incorporate fundamental analysis and major events to formulate response plans

Optimization Directions

There is room for further optimization of this strategy:

  1. Increase combinations of moving averages of various cycles to form multiple signal groups
  2. Add indicators like volume and volatility to confirm the accuracy of trend signals
  3. Use machine learning methods to dynamically optimize parameters
  4. Set up adaptive stop loss and take profit mechanisms
  5. Consider combining market sentiment, investor attention indicators
  6. Test versatility across different products
  7. Incorporate more complex breakout indicators or models

Summary

In summary, this strategy judges and follows market trends using simple moving average golden crosses and dead crosses, and controls risks with reasonable stop loss and take profit. It is an easy-to-implement trend following strategy for beginners. It deserves further research and optimization on aspects like parameters, stop loss mechanisms, optimization methods to improve strategy performance.


/*backtest
start: 2024-01-24 00:00:00
end: 2024-01-31 00:00:00
period: 10m
basePeriod: 1m
exchanges: [{"eid":"Futures_Binance","currency":"BTC_USDT"}]
*/

// This Pine Script™ code is subject to the terms of the Mozilla Public License 2.0 at https://mozilla.org/MPL/2.0/
// © KasperKvist

//@version=4
strategy("EURCHF Smart Money Strategy", overlay=true)

// Input Parameters
fastLength = input(50, title="Fast MA Length")
slowLength = input(200, title="Slow MA Length")
riskRewardRatio = input(2, title="Risk-Reward Ratio")

// Calculate Moving Averages
fastMA = sma(close, fastLength)
slowMA = sma(close, slowLength)

// Strategy Conditions
longCondition = crossover(fastMA, slowMA)
shortCondition = crossunder(fastMA, slowMA)

// Execute Strategy
strategy.entry("Long", strategy.long, when = longCondition)
strategy.entry("Short", strategy.short, when = shortCondition)

// Set Stop Loss and Take Profit
atrValue = atr(14)
stopLoss = atrValue * 1
takeProfit = atrValue * riskRewardRatio

strategy.exit("ExitLong", from_entry="Long", loss=stopLoss, profit=takeProfit)
strategy.exit("ExitShort", from_entry="Short", loss=stopLoss, profit=takeProfit)

// Plot Moving Averages
plot(fastMA, color=color.green, title="Fast MA")
plot(slowMA, color=color.red, title="Slow MA")


More