概述
KDJ阳线突破买入策略是基于KDJ指标的一个量化交易策略。该策略主要利用KDJ指标的J线和D线的黄金交叉形成买入信号,在J线上穿D线时做多入场。该策略较为简单,容易实施,适合量化交易的初学者。
策略原理
该策略使用的主要技术指标是KDJ指标。KDJ指标包含K线、D线和J线。其中:
K值=(当日收盘价-N日内最低价)÷(N日内最高价-最低价)×100;
D值=K值的M日移动平均;
J值=3K-2D。
根据KDJ指标的设定,当J值上穿D值时,表明股价反转上涨,可以做多;当J值下穿D值时,表明股价反转下跌,可以做空。
该策略就是利用上述规则,在J线上穿D线时,即金叉形成时,判断为买入信号,做多入场。 exitsignal为J线大于100时退出做多头寸。
策略优势
使用KDJ指标判断买入时机,该指标综合考虑了股价涨跌信息,较为可靠。
策略信号判断规则简单清晰,容易理解实施,适合量化交易初学者。
采用了止盈止损策略,可以有效控制风险。
策略参数优化空间大,实施灵活。
策略风险
KDJ指标容易形成虚假信号,可能导致亏损。
买入后市场短线调整可能使止损退出,无法捕捉大趋势。
参数设置不当可能导致交易频繁或信号不明显。
需关注交易成本对总体盈利的影响。
主要风险控制方法:合理优化参数,跟踪指数增强,适当放宽止损范围等。
优化方向
优化KDJ的参数,寻找最佳参数组合。
增加过滤条件,避免虚假信号。可结合其他指标或形态进行过滤。
可以根据市场类型(牛熊市)选择不同的参数设置。
可以适当放宽止损幅度,以减少止损退出的概率。
可以结合交易量等指标分析,避免被套。
总结
KDJ阳线突破买入策略整体较为简单实用,容易上手实施,特别适合量化交易的初学者。该策略有一定的交易优势,但也存在一些风险,需要针对性地进行优化,才能全面发挥策略价值。总体而言,该策略值得重点研究与应用。
策略源码
/*backtest
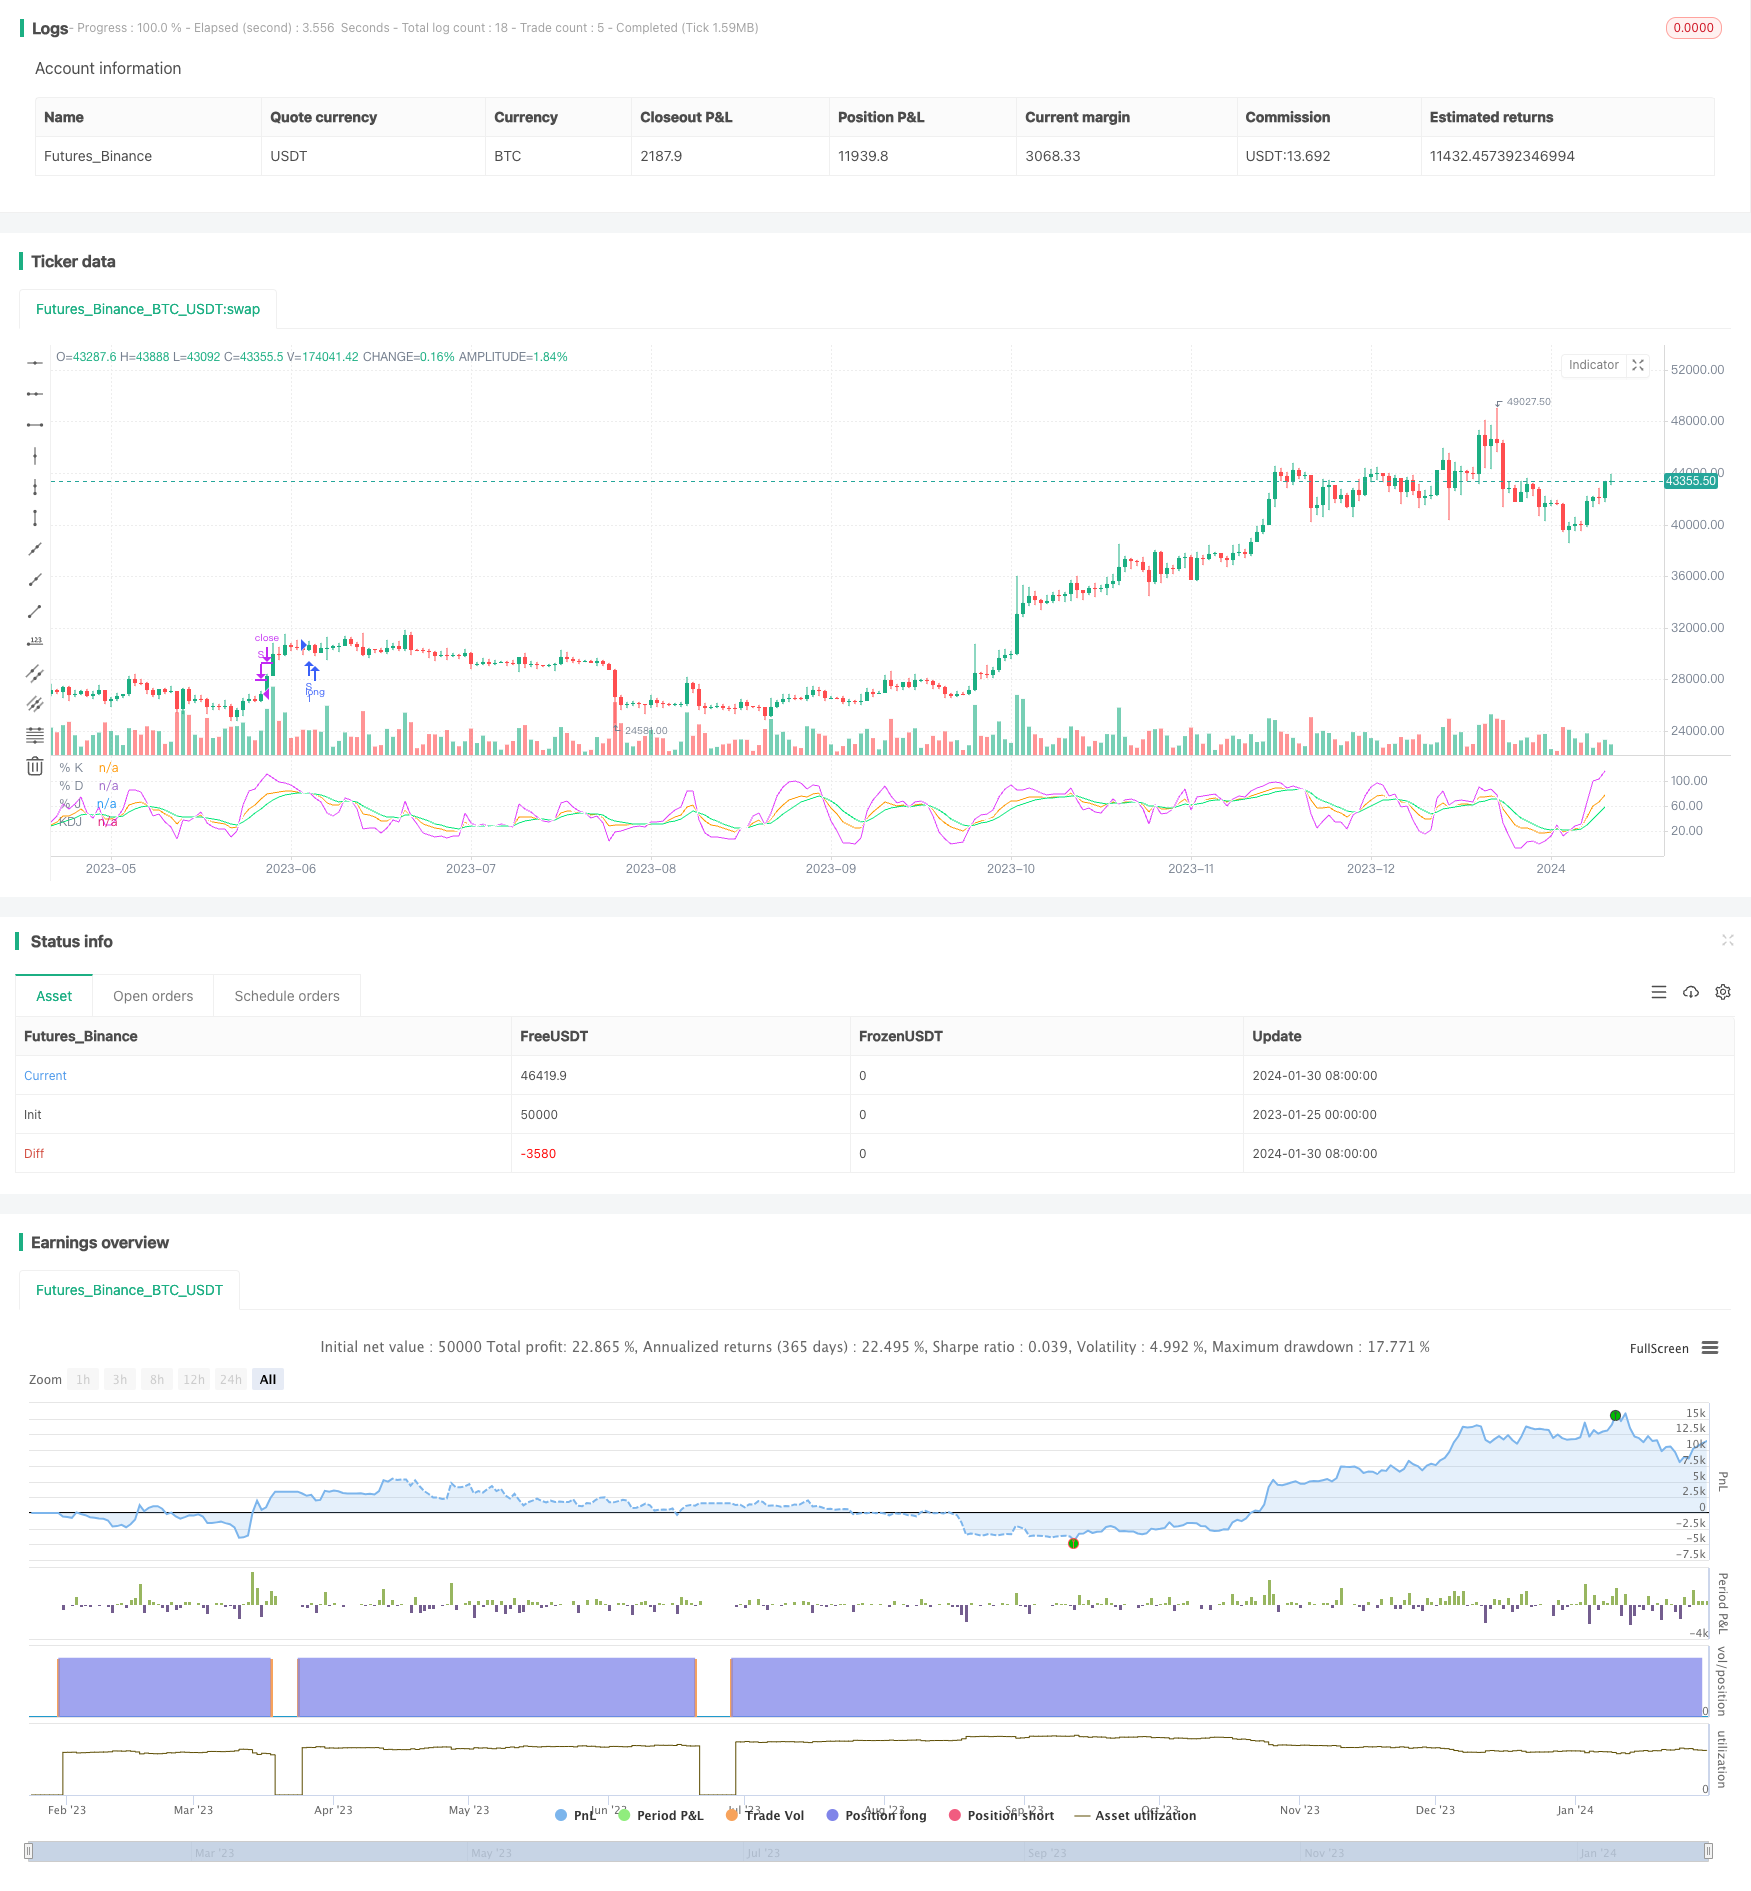
start: 2023-01-25 00:00:00
end: 2024-01-31 00:00:00
period: 1d
basePeriod: 1h
exchanges: [{"eid":"Futures_Binance","currency":"BTC_USDT"}]
*/
// ## !<------------------ Script -------------------------->
//@version=5
strategy('KDJ NVDA', shorttitle='KDJ')
ilong = input(9, title='period')
isig = input(3, title='signal')
bcwsma(s, l, m) =>
_bcwsma = float(na)
_s = s
_l = l
_m = m
_bcwsma := (_m * _s + (_l - _m) * nz(_bcwsma[1])) / _l
_bcwsma
// profit strategy add
profit_m = input.float(1.20,"Profit Margin",minval=1.0,maxval=1.99,step=0.05)
stop_m = input.float(0.98,"Stop Loss Margin",minval=0.0,maxval=1,step=0.05)
// Make input options that configure backtest date range
startDate = input.int(title="Start Date", defval=1, minval=1,maxval=31)
startMonth = input.int(title="Start Month", defval=1,minval=1,maxval=12)
startYear = input.int(title="Start Year", defval=2023,minval=2018,maxval=2024)
endDate = input.int(title="End Date", defval=1, minval=1,maxval=31)
endMonth = input.int(title="End Month", defval=1,minval=1,maxval=12)
endYear = input.int(title="End Year", defval=2024,minval=2018,maxval=2099)
// intialization of variables
// Look if the close time of the current bar
// falls inside the date range
inDateRange = (time >= timestamp(syminfo.timezone, startYear,startMonth, startDate, 0, 0)) and (time < timestamp(syminfo.timezone, endYear, endMonth, endDate, 0, 0))
c = close
h = ta.highest(high, ilong)
l = ta.lowest(low, ilong)
RSV = 100 * ((c - l) / (h - l))
pK = bcwsma(RSV, isig, 1)
pD = bcwsma(pK, isig, 1)
pJ = 3 * pK - 2 * pD
KDJ = math.avg(pD, pJ, pK)
go_long= ta.crossunder(pD,pJ)
if (inDateRange and go_long)
strategy.entry("S",strategy.long,comment="C")
// strategy.exit("S", limit=c*profit_m, stop=c*stop_m, comment="SL/SP")
if (inDateRange and pJ > 100)
strategy.close("S", comment="TP")
// Plot options
// plot(pK, color= #1E88E5)
// plot(pD, color=#FF6F00)
// plot(ma, color=color.yellow)
// bgcolor(pJ>pD? color.green : color.red)
plot(pK, title='% K', color=color.new(color.orange, 0))
plot(pD, title='% D', color=color.new(color.lime, 0))
plot(pJ, title='% J', color=color.new(color.fuchsia, 0))
plot(KDJ, title='KDJ', color=color.new(color.white, 0))
// </PINE> </SCRIPT>
// ## This source code is subject to the terms of the ozilla Public License 2.0 at https://mozilla.org/MPL/2.0/
// ## !<------------------ End Script -------------------------->