Short-Term Trading Strategy Based on RSI and SMA

Overview
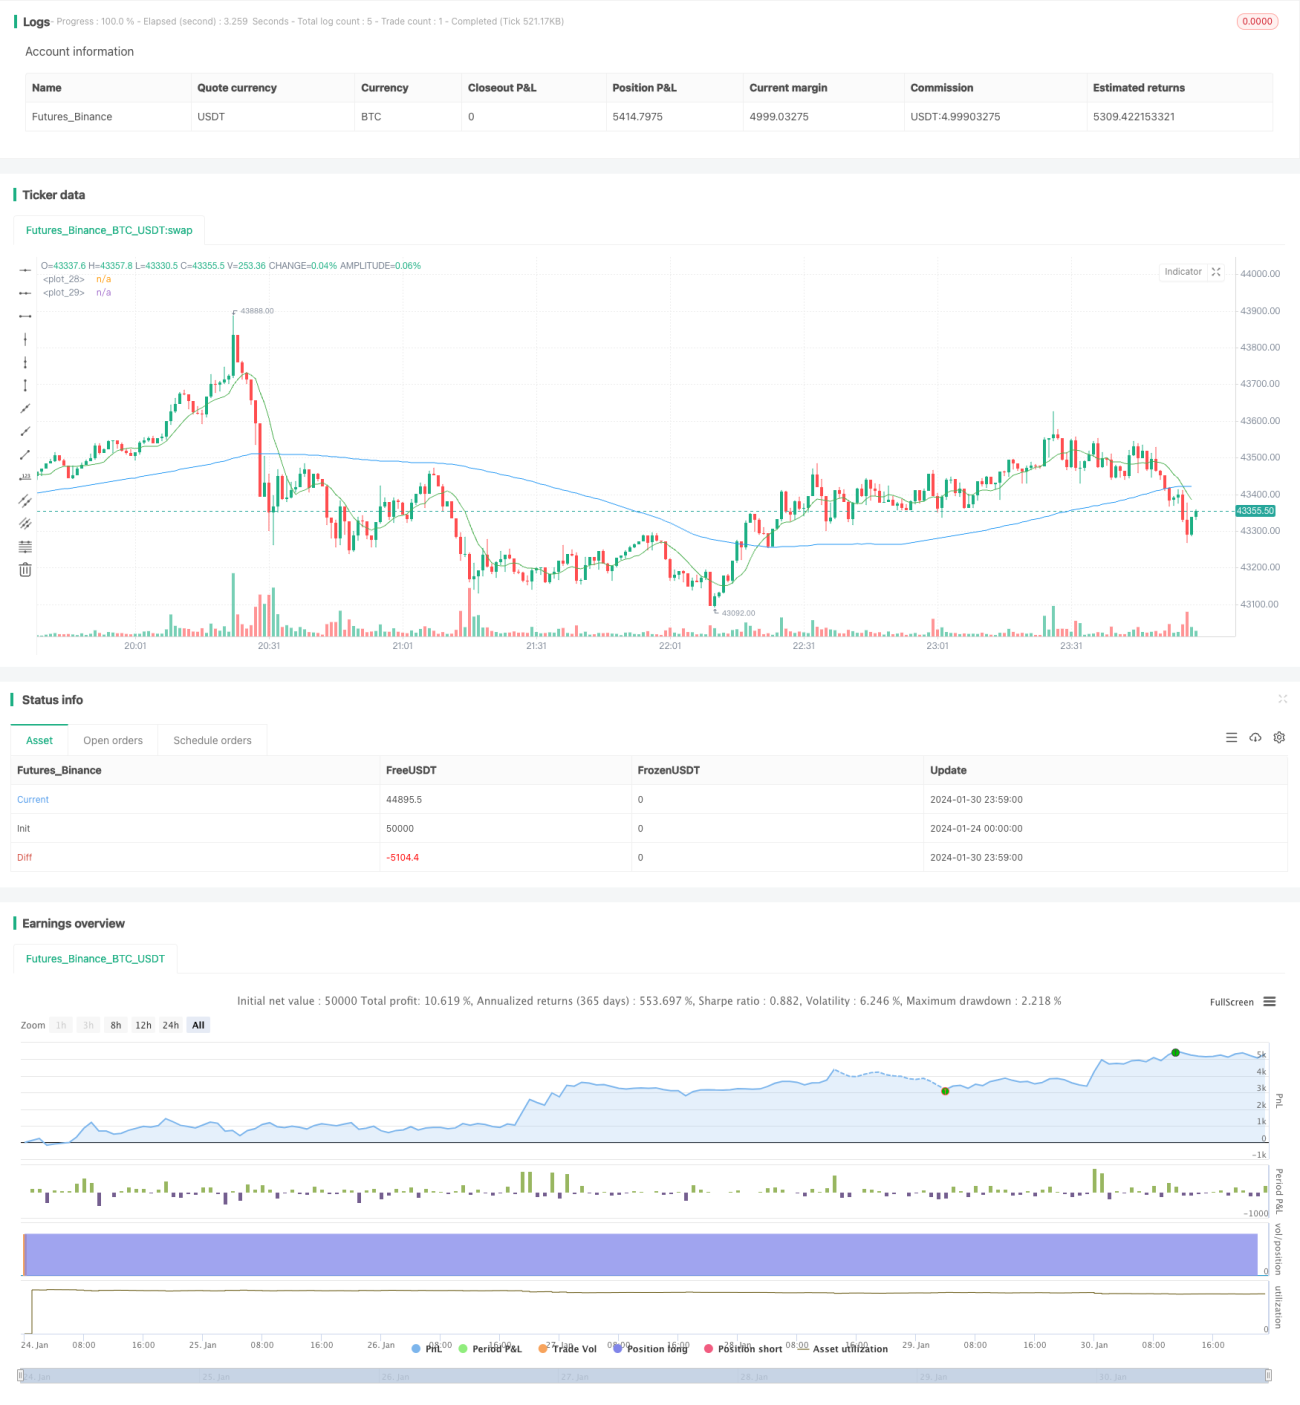
This strategy is named "Short-Term RSI and SMA Percentage Change". It utilizes common technical indicators like RSI and moving average to determine entry and exit of trades. RSI is a momentum oscillator that has a value between 0 and 100, where a value above 70 is considered overbought and below 30 oversold. SMA is a simple moving average that can reflect short-term and long-term price trends. This strategy builds entry and exit signals based on these two indicators, and backtest shows it can achieve good performance.
Strategy Logic
When RSI is above 50, it is considered a bullish signal. This indicates the market is in equilibrium to bullish zone. When 9-day SMA is above 100-day SMA, it means the short-term trend is better than the long-term trend, and we can enter a long position. In addition, if the short-term 9-day SMA has a relative change of more than 6% to price, it indicates acceleration of short-term trend, which is also an entry signal.
If already in a long position, this strategy will use parabolic SAR trailing stop to lock in profits. It will exit positions when price pulls back according to the percentage of trailing stop loss set.
Advantage Analysis
This strategy combines trend indicators and oscillators, so that it can enter the market when a clear trend appears, while avoiding periods when the market is reversing, greatly reducing trading risk. The stop loss strategy can also lock in profits and prevent profits from evaporating completely when trend reverses.
Backtest shows this strategy can profit in fairly obvious short-term trends with good results. It suits investors who pursue high frequency trading.
Risk Analysis
This strategy relies on indicators like RSI and SMA, which have certain laggingness. When sudden events cause rapid market reversal, this strategy may fail to exit in time, leading to large losses.
In addition, high frequency trading bears higher trading costs. If trading frequency is too high, accumulated trading fees can also impact profits.
Optimization Directions
This strategy can consider incorporating more indicators to determine entry and exit signals, such as adding volume indicators to avoid false breakouts. Stop loss strategy can also be adjusted to more flexible ways, taking into account market fluctuations.
In addition, optimization can be done on trading products, cycle parameters to find the best parameter combination. Cross-cycle trading can also be considered, using higher cycles to determine trend direction, and lower cycles to decide entry.
Conclusion
This strategy "Short-term RSI and SMA Percentage Change" comprehensively employs common technical indicators like RSI and SMA to construct short-term trading strategy. It can seize fairly obvious short-term trends to profit, while also having stops to lock in profits. This strategy suits investors who like high frequency trading, but the risk of rapid market reversal also needs attention. With further optimization, this strategy can achieve better results.
- 1