概述
三重均线波段策略运用多条移动平均线指标,通过对K线进行深入分析挖掘隐藏在价格波动之中的规律,实现低风险套利交易。
策略原理
该策略在布林线基础上叠加多组EMA指标,构建价格通道,发现价格波动规律。具体来说:
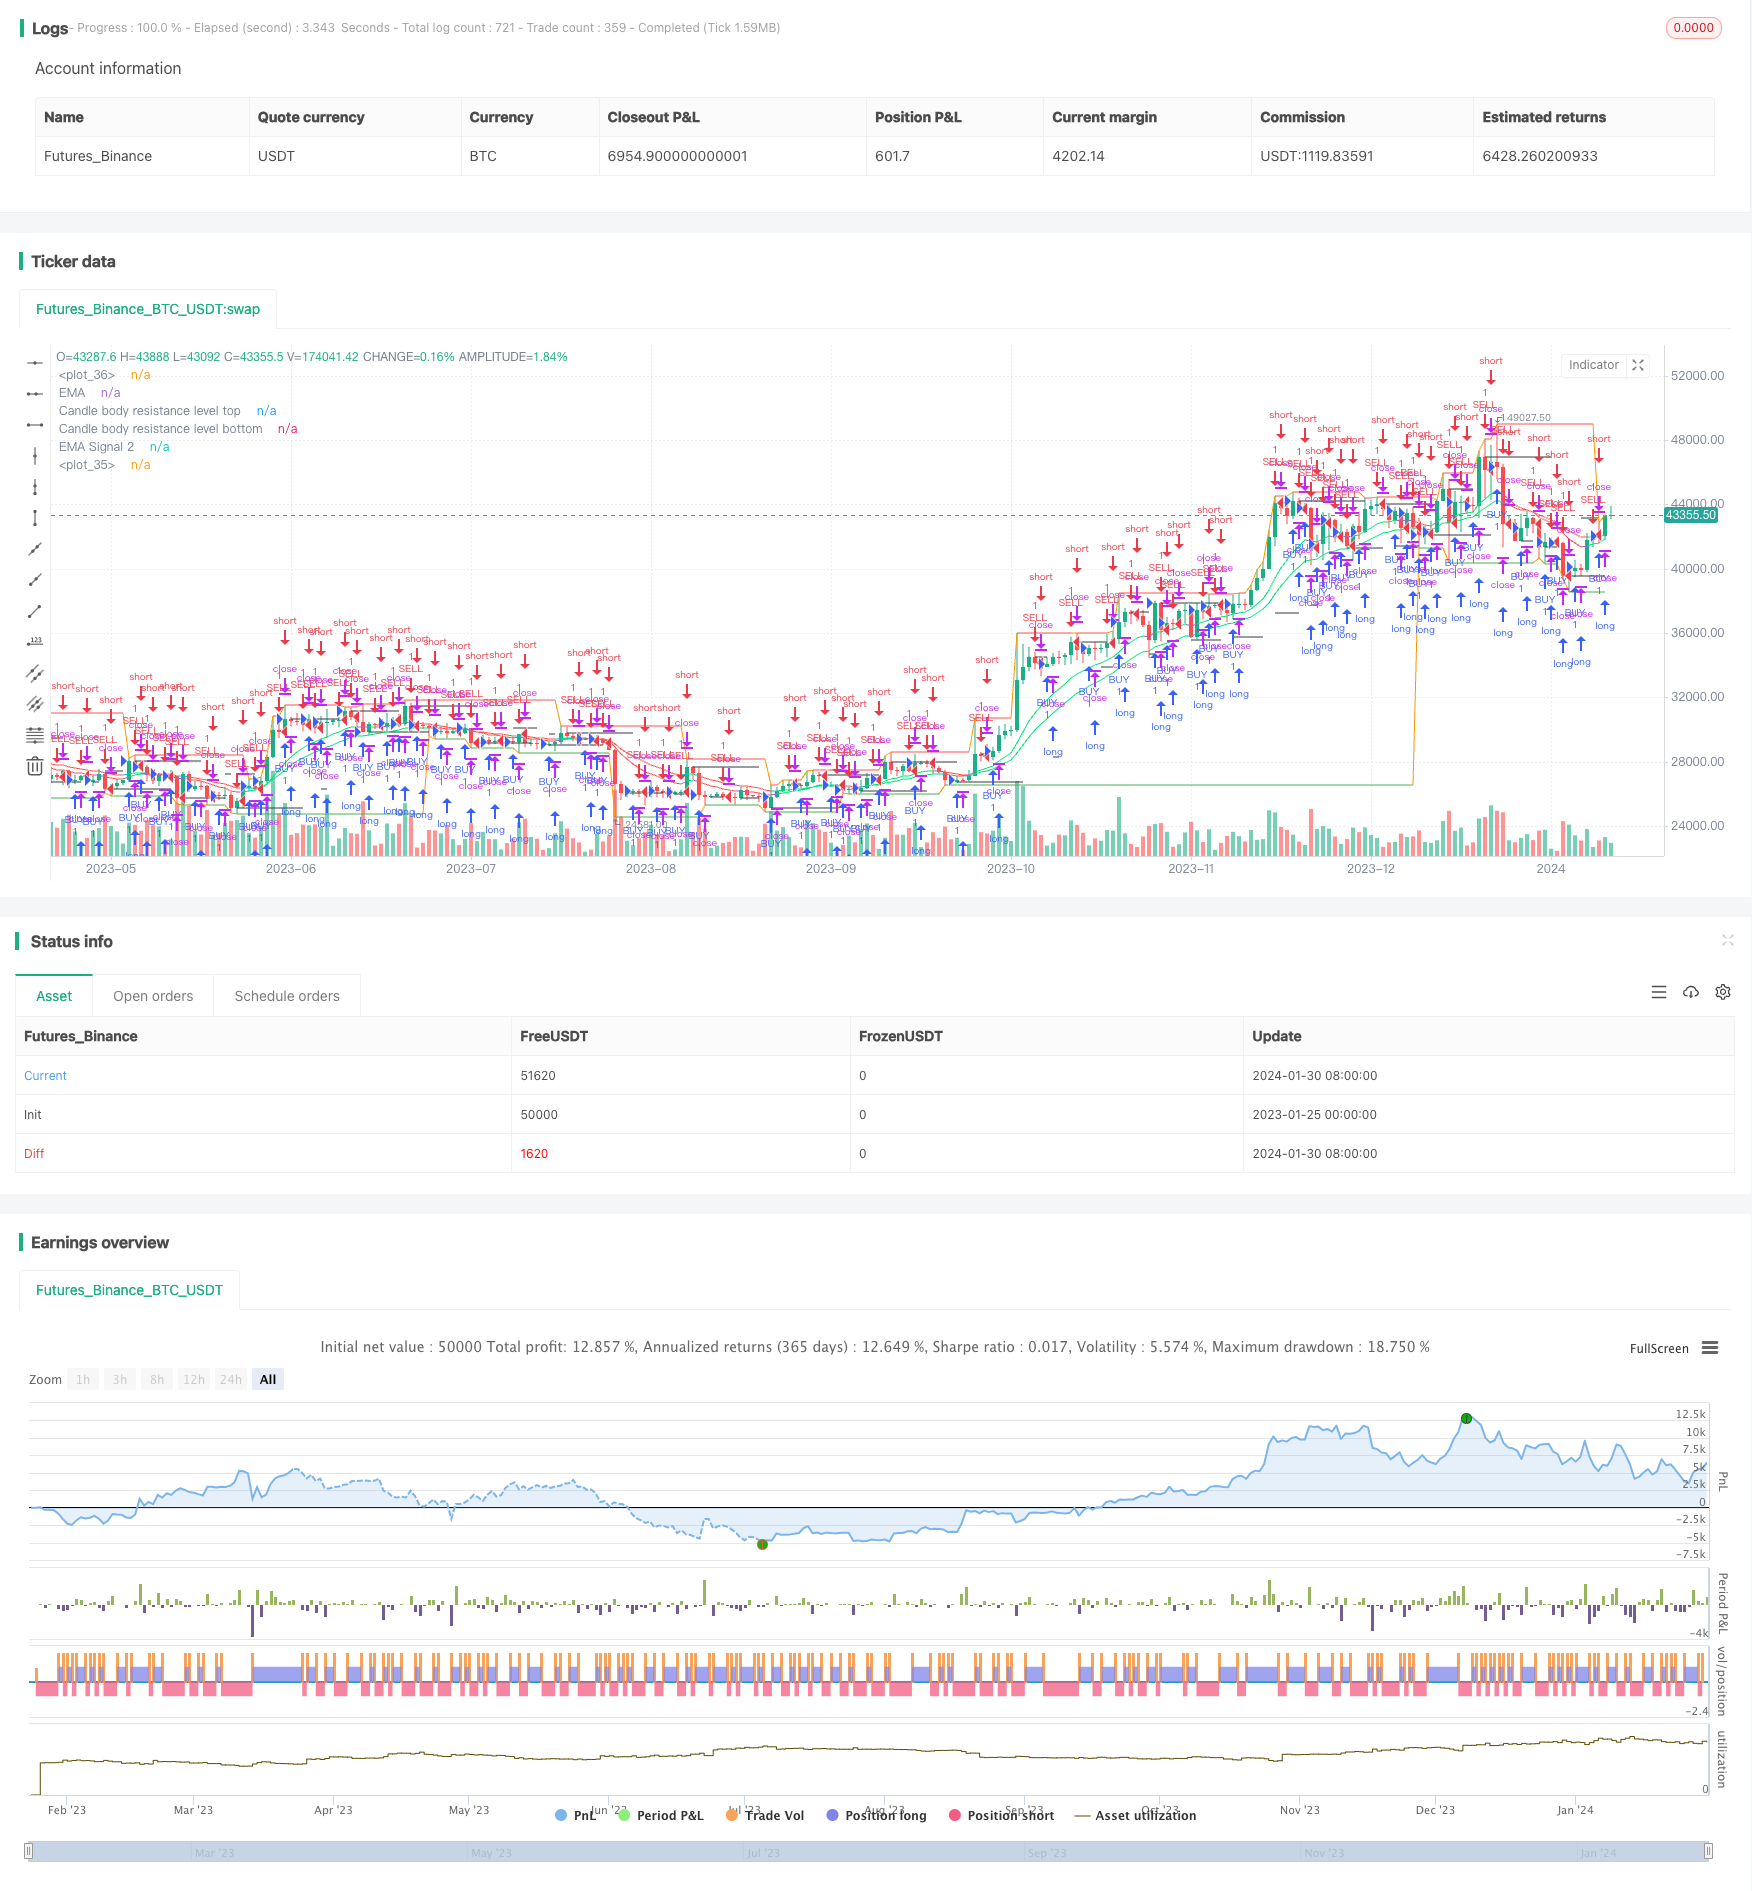
- 使用BodyResistanceChannel指标绘制K线实体阻力位。
- 使用Support/Resistance指标绘制多日支撑和阻力位。
- 使用双EMA系统判断价格趋势方向。
- 使用Hull均线指标平滑价格曲线。
在此基础上结合形态识别,判断反转机会,制定套利交易策略。
优势分析
该策略具有以下优势:
- 使用多组EMA构建价格通道,可明确判断价格波动走向。
- 应用Hull均线指标可有效平滑价格突破判断。
- 结合反转形态和通道指标,实现高概率低风险交易。
- 构建多层指标体系,交易信号稳定可靠。
风险分析
该策略也存在以下风险:
- 价格通道破裂引发巨额亏损的风险。针对性解决方案是采用移动止损,降低单笔损失。
- 反转形态判断错误引发错误信号的风险。针对性解决方案是优化参数,提高形态判断准确率。
- 指标参数不匹配导致交易信号质量下降的风险。针对性解决方案是多组合参数优化测试。
优化方向
该策略主要可优化的方向有:
- 优化EMA周期参数组合,使指标更加匹配市场特征。
- 调整止损位置,在保证盈利的前提下最大限度降低单笔亏损风险。
- 增加基于波动率的动态仓位调整模块,有效控制风险。
- 利用深度学习技术挖掘更多价格规律,提高信号质量。
总结
三重均线波段策略深入挖掘价格波动规律,稳定高效,值得长期应用与持续优化。投资需要理性和耐心,渐进做单才是致胜之道。
策略源码
/*backtest
start: 2023-01-25 00:00:00
end: 2024-01-31 00:00:00
period: 1d
basePeriod: 1h
exchanges: [{"eid":"Futures_Binance","currency":"BTC_USDT"}]
*/

//@version=3
//╭╮╱╱╭╮╭╮╱╱╭╮
//┃╰╮╭╯┃┃┃╱╱┃┃
//╰╮┃┃╭┻╯┣╮╭┫╰━┳╮╭┳━━╮
//╱┃╰╯┃╭╮┃┃┃┃╭╮┃┃┃┃━━┫
//╱╰╮╭┫╰╯┃╰╯┃╰╯┃╰╯┣━━┃
//╱╱╰╯╰━━┻━━┻━━┻━━┻━━╯
//╭━━━┳╮╱╱╱╱╱╱╱╭╮
//┃╭━╮┃┃╱╱╱╱╱╱╱┃┃
//┃┃╱╰┫╰━┳━━┳━╮╭━╮╭━━┫┃
//┃┃╱╭┫╭╮┃╭╮┃╭╮┫╭╮┫┃━┫┃
//┃╰━╯┃┃┃┃╭╮┃┃┃┃┃┃┃┃━┫╰╮
//╰━━━┻╯╰┻╯╰┻╯╰┻╯╰┻━━┻━╯
//━╯
// http://www.vdubus.co.uk/
strategy(title='Vdub FX SniperVX3 / Strategy  v3', shorttitle='Vdub_FX_SniperVX3_Strategy', overlay=true, pyramiding=0, initial_capital=1000, currency=currency.USD)

//Candle body resistance Channel-----------------------------//
len = 34
src = input(close, title="Candle body resistance Channel")
out = sma(src, len)
last8h = highest(close, 13)
lastl8 = lowest(close, 13)
bearish = cross(close,out) == 1 and falling(close, 1)
bullish = cross(close,out) == 1 and rising(close, 1)
channel2=input(false, title="Bar Channel On/Off")
ul2=plot(channel2?last8h:last8h==nz(last8h[1])?last8h:na, color=black, linewidth=1, style=linebr, title="Candle body resistance level top", offset=0)
ll2=plot(channel2?lastl8:lastl8==nz(lastl8[1])?lastl8:na, color=black, linewidth=1, style=linebr, title="Candle body resistance level bottom", offset=0)
//fill(ul2, ll2, color=black, transp=95, title="Candle body resistance Channel")

//-----------------Support and Resistance
RST = input(title='Support / Resistance length:', defval=10)
RSTT = valuewhen(high >= highest(high, RST), high, 0)
RSTB = valuewhen(low <= lowest(low, RST), low, 0)
RT2 = plot(RSTT, color=RSTT != RSTT[1] ? na : red, linewidth=1, offset=+0)
RB2 = plot(RSTB, color=RSTB != RSTB[1] ? na : green, linewidth=1, offset=0)

//--------------------Trend colour ema------------------------------------------------//
src0 = close, len0 = input(13, minval=1, title="EMA 1")
ema0 = ema(src0, len0)
direction = rising(ema0, 2) ? +1 : falling(ema0, 2) ? -1 : 0
plot_color = direction > 0  ? lime: direction < 0 ? red : na
plot(ema0, title="EMA", style=line, linewidth=1, color = plot_color)

//-------------------- ema 2------------------------------------------------//
src02 = close, len02 = input(21, minval=1, title="EMA 2")
ema02 = ema(src02, len02)
direction2 = rising(ema02, 2) ? +1 : falling(ema02, 2) ? -1 : 0
plot_color2 = direction2 > 0  ? lime: direction2 < 0 ? red : na
plot(ema02, title="EMA Signal 2", style=line, linewidth=1, color = plot_color2)

//=============Hull MA//
show_hma = input(false, title="Display Hull MA Set:")
hma_src = input(close, title="Hull MA's Source:")
hma_base_length = input(8, minval=1, title="Hull MA's Base Length:")
hma_length_scalar = input(5, minval=0, title="Hull MA's Length Scalar:")
hullma(src, length)=>wma(2*wma(src, length/2)-wma(src, length), round(sqrt(length)))
plot(not show_hma ? na : hullma(hma_src, hma_base_length+hma_length_scalar*6), color=black, linewidth=2, title="Hull MA")

//============ signal Generator ==================================//
Piriod=input('720')
ch1 = request.security(syminfo.tickerid, Piriod, open)
ch2 = request.security(syminfo.tickerid, Piriod, close)
longCondition = crossover(request.security(syminfo.tickerid, Piriod, close),request.security(syminfo.tickerid, Piriod, open))
if (longCondition)
    strategy.entry("BUY", strategy.long)
shortCondition = crossunder(request.security(syminfo.tickerid, Piriod, close),request.security(syminfo.tickerid, Piriod, open))
if (shortCondition)
    strategy.entry("SELL", strategy.short)

///////////////////////////////////////////////////////////////////////////////////////////