概述
该策略采用了布林带、RSI、ADX、MACD等多个指标对市场趋势进行判断,具有较强的趋势识别能力。当指标信号同时 bullish 时,采取追涨策略;当指标信号同时 bearish 时,平仓止损。
策略原理
- 使用布林带判断价格是否处在布林带上轨或下轨附近,作为判定趋势是否形成的依据
- 结合RSI指标判断是否处于超买超卖区域,避免假突破
- 使用ADX判断趋势力度,只有在趋势力度较强时才发出信号
- 采用MACD判断短期和长期趋势一致性
- 结合日内时间段,只在指定交易时段交易
通过多指标组合判断,准确识别价格趋势,在趋势发生时及时追踪,实现超额收益。
优势分析
该策略最大的优势在于指标组合判断较为全面和准确,能有效识别价格趋势,避免因单一指标造成的假信号。
具体来说,优势有:
- 布林带能判断价格波动范围和强弱程度
- RSI避免买进超买区域,卖出超卖区域
- ADX判断趋势力度,只跟随强势趋势
- MACD判断短长线一致性
- 限定交易时段,避免隔夜风险
通过指标组合判断,能最大程度减少假信号,增强策略稳定性。
风险分析
该策略主要风险来自:
- 突发事件造成指标失效
- 震荡行情中产生大量假信号
针对风险1,由于依赖多个指标,能够一定程度上避免单一指标失效的问题,但仍需完善风控机制。
针对风险2,可适当调整参数,缩小交易区间,减少交易频率,降低风险。
优化方向
该策略主要可优化的方向包括:
- 增加止损机制,如移动止损、时间止损、突破止损等,避免拉回过深
- 优化参数,调整指标参数组合,寻找最优参数
- 增加过滤条件,如成交量过滤,避免量小的假突破
- 结合更多指标,如KDJ、OBV等,提升信号准确性
- 采用机器学习方法自动优化参数
通过持续优化,不断提高策略参数健壮性,降低假信号概率。
总结
该策略整体来说识别趋势信号能力较强,通过指标组合判断,能有效识别价格趋势,max|max|
但是也存在一定风险,需要不断完善风控机制,持续优化参数,才能长期稳定运作。如果后期能引入机器学习等方法实现参数自动优化,将大大增强策略的鲁棒性和收益能力。
策略源码
/*backtest
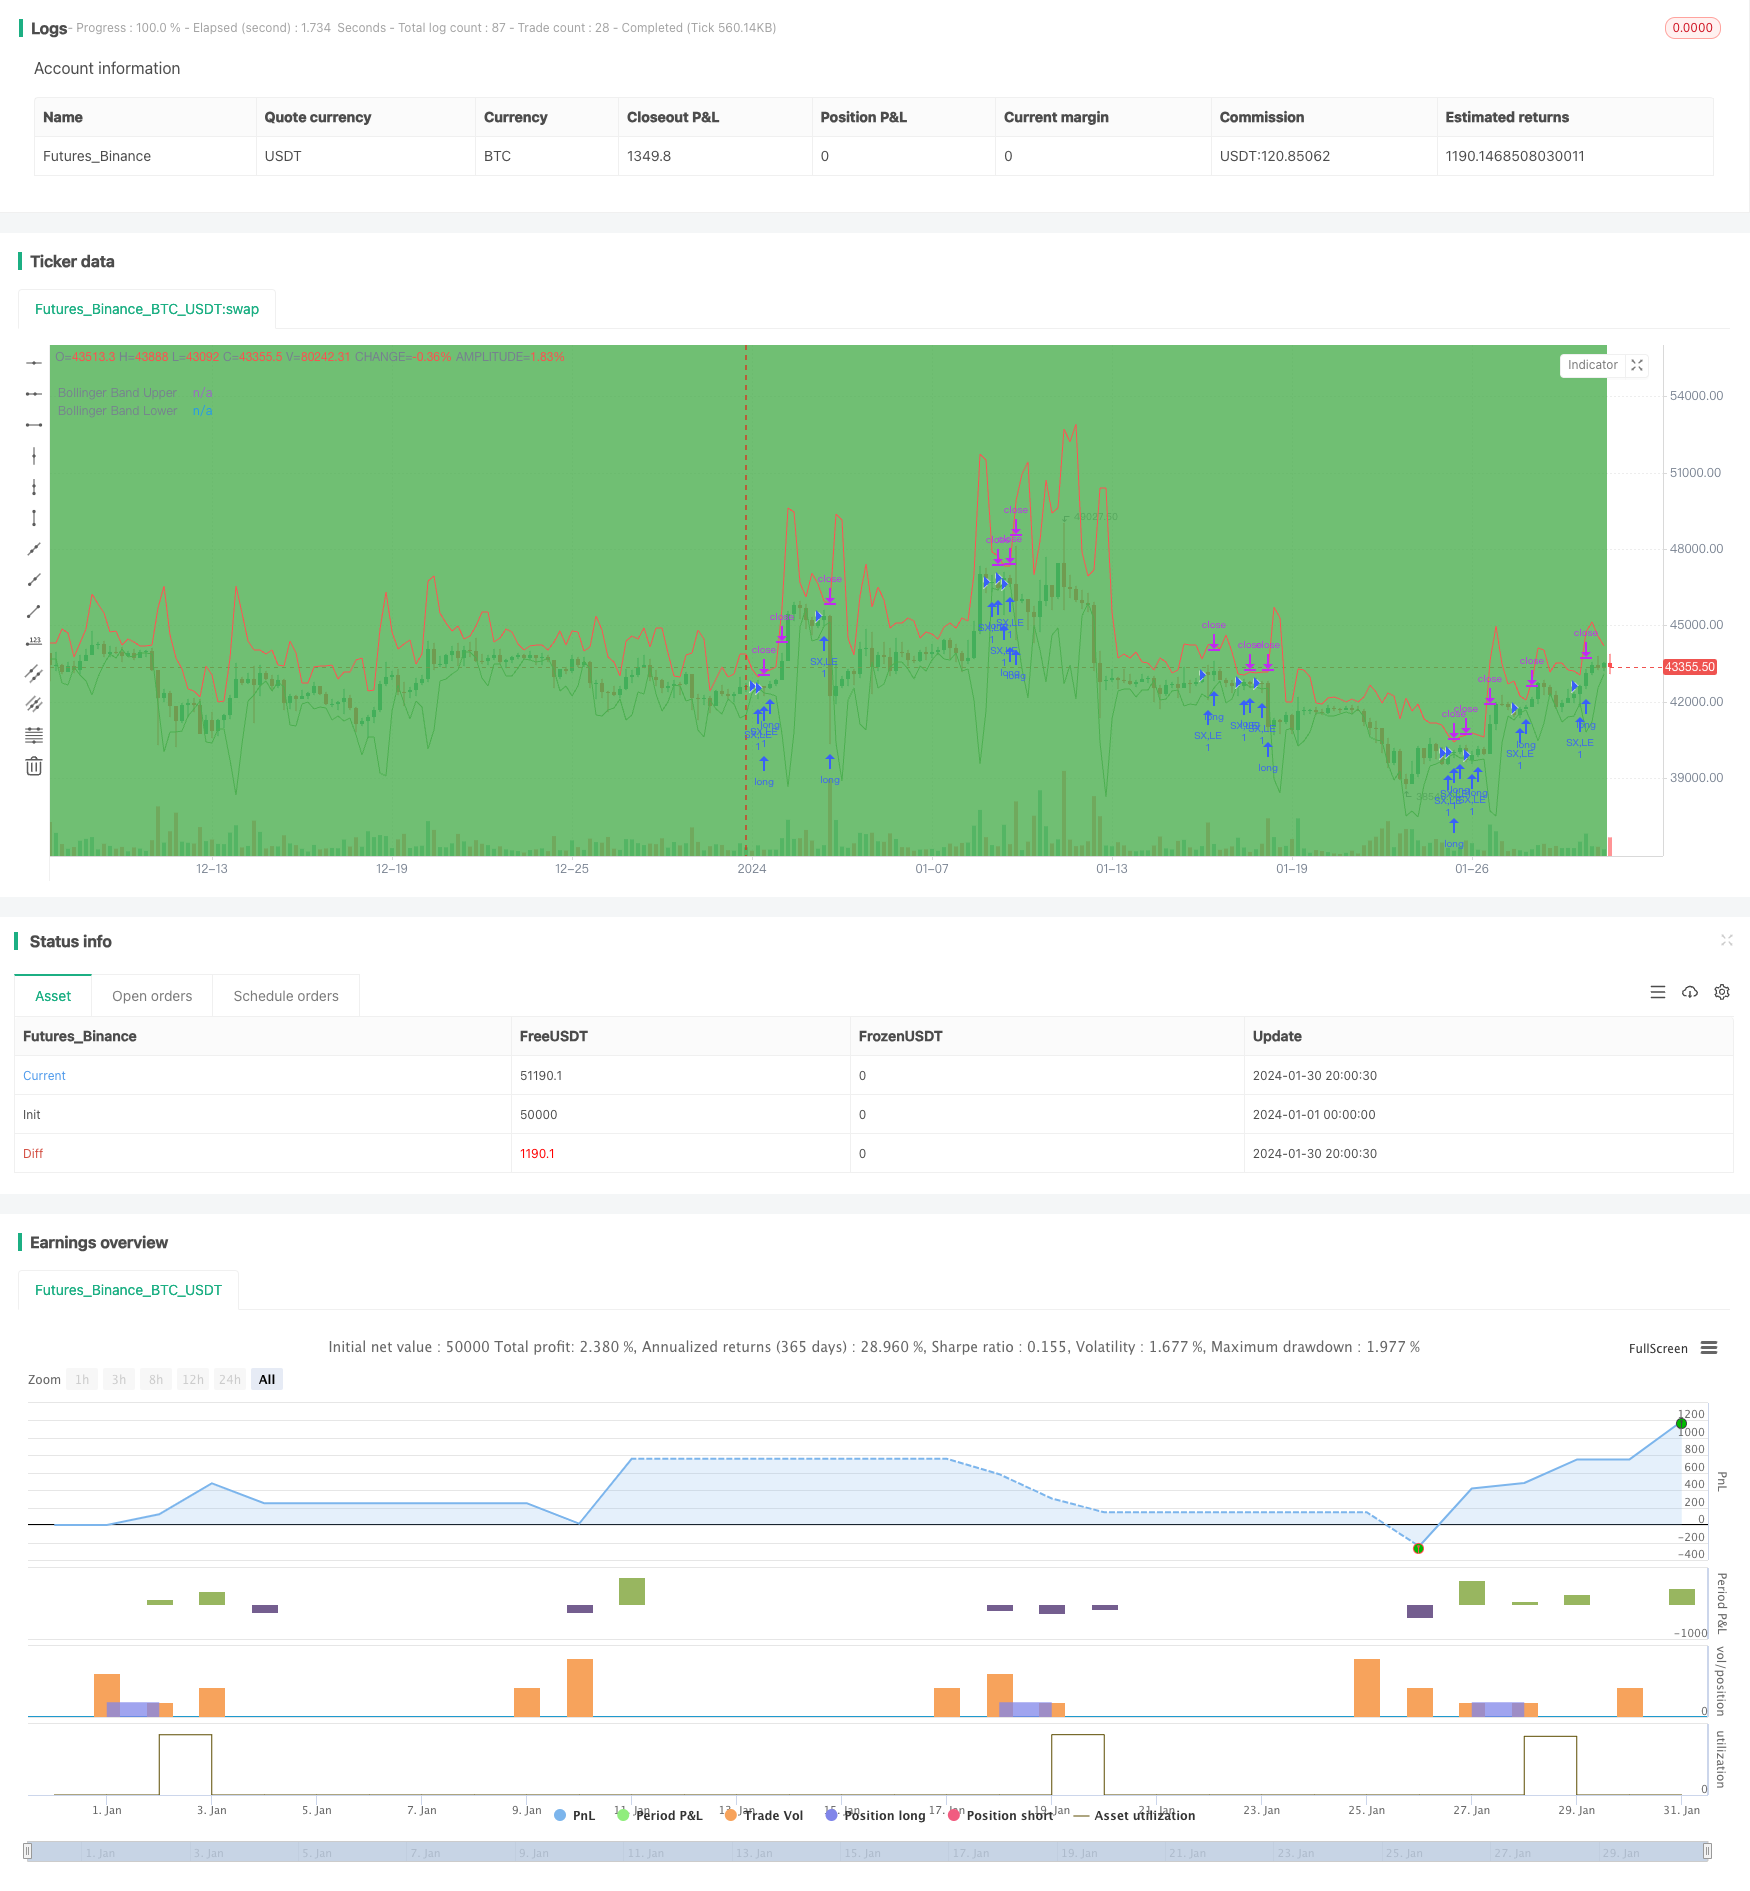
start: 2024-01-01 00:00:00
end: 2024-01-31 00:00:00
period: 5h
basePeriod: 15m
exchanges: [{"eid":"Futures_Binance","currency":"BTC_USDT"}]
*/
// This source code is subject to the terms of the Mozilla Public License 2.0 at https://mozilla.org/MPL/2.0/
// © abilash.s.90
dIMinusCalc(adxLen) =>
smoothedTrueRange = 0.0
smoothedDirectionalMovementMinus = 0.0
dIMinus = 0.0
trueRange = 0.0
directionalMovementMinus = 0.0
trueRange := max(max(high-low, abs(high-nz(close[1]))), abs(low-nz(close[1])))
directionalMovementMinus := nz(low[1])-low > high-nz(high[1]) ? max(nz(low[1])-low, 0): 0
smoothedTrueRange := nz(smoothedTrueRange[1]) - (nz(smoothedTrueRange[1])/adxLen) + trueRange
smoothedDirectionalMovementMinus := nz(smoothedDirectionalMovementMinus[1]) - (nz(smoothedDirectionalMovementMinus[1])/adxLen) + directionalMovementMinus
dIMinus := smoothedDirectionalMovementMinus / smoothedTrueRange * 100
dIMinus
dIPlusCalc(adxLen) =>
smoothedTrueRange = 0.0
smoothedDirectionalMovementPlus = 0.0
dIPlus = 0.0
trueRange = 0.0
directionalMovementPlus = 0.0
trueRange := max(max(high-low, abs(high-nz(close[1]))), abs(low-nz(close[1])))
directionalMovementPlus := high-nz(high[1]) > nz(low[1])-low ? max(high-nz(high[1]), 0): 0
smoothedTrueRange := nz(smoothedTrueRange[1]) - (nz(smoothedTrueRange[1])/adxLen) + trueRange
smoothedDirectionalMovementPlus := nz(smoothedDirectionalMovementPlus[1]) - (nz(smoothedDirectionalMovementPlus[1])/adxLen) + directionalMovementPlus
dIPlus := smoothedDirectionalMovementPlus / smoothedTrueRange * 100
dIPlus
Adx(adxLen) =>
dIPlus = 0.0
dIMinus = 0.0
dX = 0.0
aDX = 0.0
dIPlus := dIPlusCalc(adxLen)
dIMinus := dIMinusCalc(adxLen)
dX := abs(dIPlus-dIMinus) / (dIPlus+dIMinus)*100
aDX := sma(dX, adxLen)
aDX
BarInSession(sess) => time(timeframe.period, sess) != 0
//@version=4
strategy("Bollinger Band + RSI + ADX + MACD", overlay=true)
//Session
session = input(title="Trading Session", type=input.session, defval="0930-1500")
sessionColor = BarInSession(session) ? color.green : na
bgcolor(color=sessionColor, transp=95)
// Bollinger Bands
src = input(high, title="Bollinger Band Source", type=input.source)
length = input(3, minval=1, type=input.integer, title="Bollinger Band Length")
mult = input(4.989, minval=0.001, maxval=50, step=0.001, type=input.float, title="Bollinger Band Std Dev")
basis = sma(src, length)
dev = mult * stdev(src, length)
upper = basis + dev
lower = basis - dev
plot(upper, title="Bollinger Band Upper", color=color.red)
plot(lower, title="Bollinger Band Lower", color=color.green)
// RSI
rsiSrc = input(close, title="RSI Source", type=input.source)
rsiLength = input(16, minval=1, type=input.integer, title="RSI Length")
rsiComparator = input(39.2, title="RSI Comparator", type=input.float, step=0.1)
rsi = rsi(rsiSrc, rsiLength)
// ADX
adxLength = input(14, minval=1, type=input.integer, title="ADX Length")
adxComparator = input(14, minval=1, type=input.integer, title="ADX Comparator")
adx = Adx(adxLength)
// Heikinashi
haClose = security(heikinashi(syminfo.ticker), timeframe.period, close)
haOpen = security(heikinashi(syminfo.ticker), timeframe.period, open)
nextHaOpen = (haOpen + haClose) / 2
//MACD
macdCalcTypeProcessed = input(title="MACD Source", type=input.source, defval=high)
fast = input(12, title="MACD Fast")
slow = input(20, title="MACD Slow")
signalLen = input(15, title="MACD Signal")
fastMA = ema(macdCalcTypeProcessed, fast)
slowMA = ema(macdCalcTypeProcessed, slow)
macd = fastMA - slowMA
signal = sma(macd, signalLen)
longCondition() =>
(low < lower) and (rsi[0] > rsiComparator) and (adx > adxComparator) and (close > nextHaOpen) and BarInSession(session) and macd > signal
stop = (close - max((low - (low * 0.0022)), (close - (close * 0.0032)))) / syminfo.mintick
target = (max(upper, (close + (close * 0.0075))) - close) / syminfo.mintick
strategy.entry("SX,LE", strategy.long, when=longCondition(), comment="SX,LE")
strategy.close_all(when=(not BarInSession(session)))
strategy.exit("LX", from_entry="SX,LE", profit=target, loss=stop)