概述
基于Renko平均真实波幅的趋势反转策略(Renko ATR Trend Reversal Strategy)是一种独特的交易策略,旨在利用Renko图表结合平均真实波幅(ATR)指标来识别金融市场的趋势反转点。该策略消除了Renko图的滞后绘制问题,能够准确地捕捉转折点,为交易决策提供清晰的信号。
策略原理
Renko砖块生成
该策略首先计算一定周期内的ATR的值,并以此ATR为基准设置Renko图的砖块大小。当价格变动超过一个ATR时,则绘制新的Renko砖块。通过这种方式,Renko图能够自动适应市场的波动程度,在高波动时设置较大的砖块大小,在低波动时设置较小的砖块大小。
买入和卖出信号生成
当Renko开盘价下穿收盘价时,产生买入信号;当Renko开盘价上穿收盘价时,产生卖出信号。这些信号标志着潜在的趋势反转点。
止损和止盈设置
该策略会根据用户定义的止损百分比和止盈百分比,以Renko开盘价为基准动态设置每单的止损价位和止盈价位,控制每单交易的风险和收益。
优势分析
消除滞后绘制
该策略通过手动计算Renko的开盘价和收盘价消除了滞后绘制的问题,使信号的产生更加准确和及时。
自动适应市场波动率
基于ATR指标的Renko砖块大小设置使得策略可以自动适应不同市场条件下的价格波动率。
动态止损止盈设定
该策略为每单交易设定了动态的止损和止盈机制,可以根据市场波动程度来控制风险。
简化的图表视图
Renko图本身可以滤除市场噪音,识别趋势反转时提供清晰简洁的视觉效果。
风险分析
参数优化风险
用户需要对ATR周期、止损百分比和止盈百分比等参数进行优化,以适应不同的市场环境。如果参数设置不当,会导致策略效果不佳。
突发事件风险
重大经济事件或者政策出台可能导致快速放量,从而使止损或止盈水平被突破,造成较大损失。
反转失败风险
在某些情况下,交易信号判定的反转可能失败,无法推动价格朝反转方向发展,从而导致亏损。
优化方向
结合多个时间周期
可以在更高的时间周期上判断大趋势,避免逆势交易。也可以在更低的时间周期过滤假信号。
结合其他指标
与动量指标、波动率指标等结合使用,可以提高信号的质量,避免错误信号。
动态调整止盈比率
可以根据市场波动程度以及最新价格与入场点的距离动态调整止盈的比率。
总结
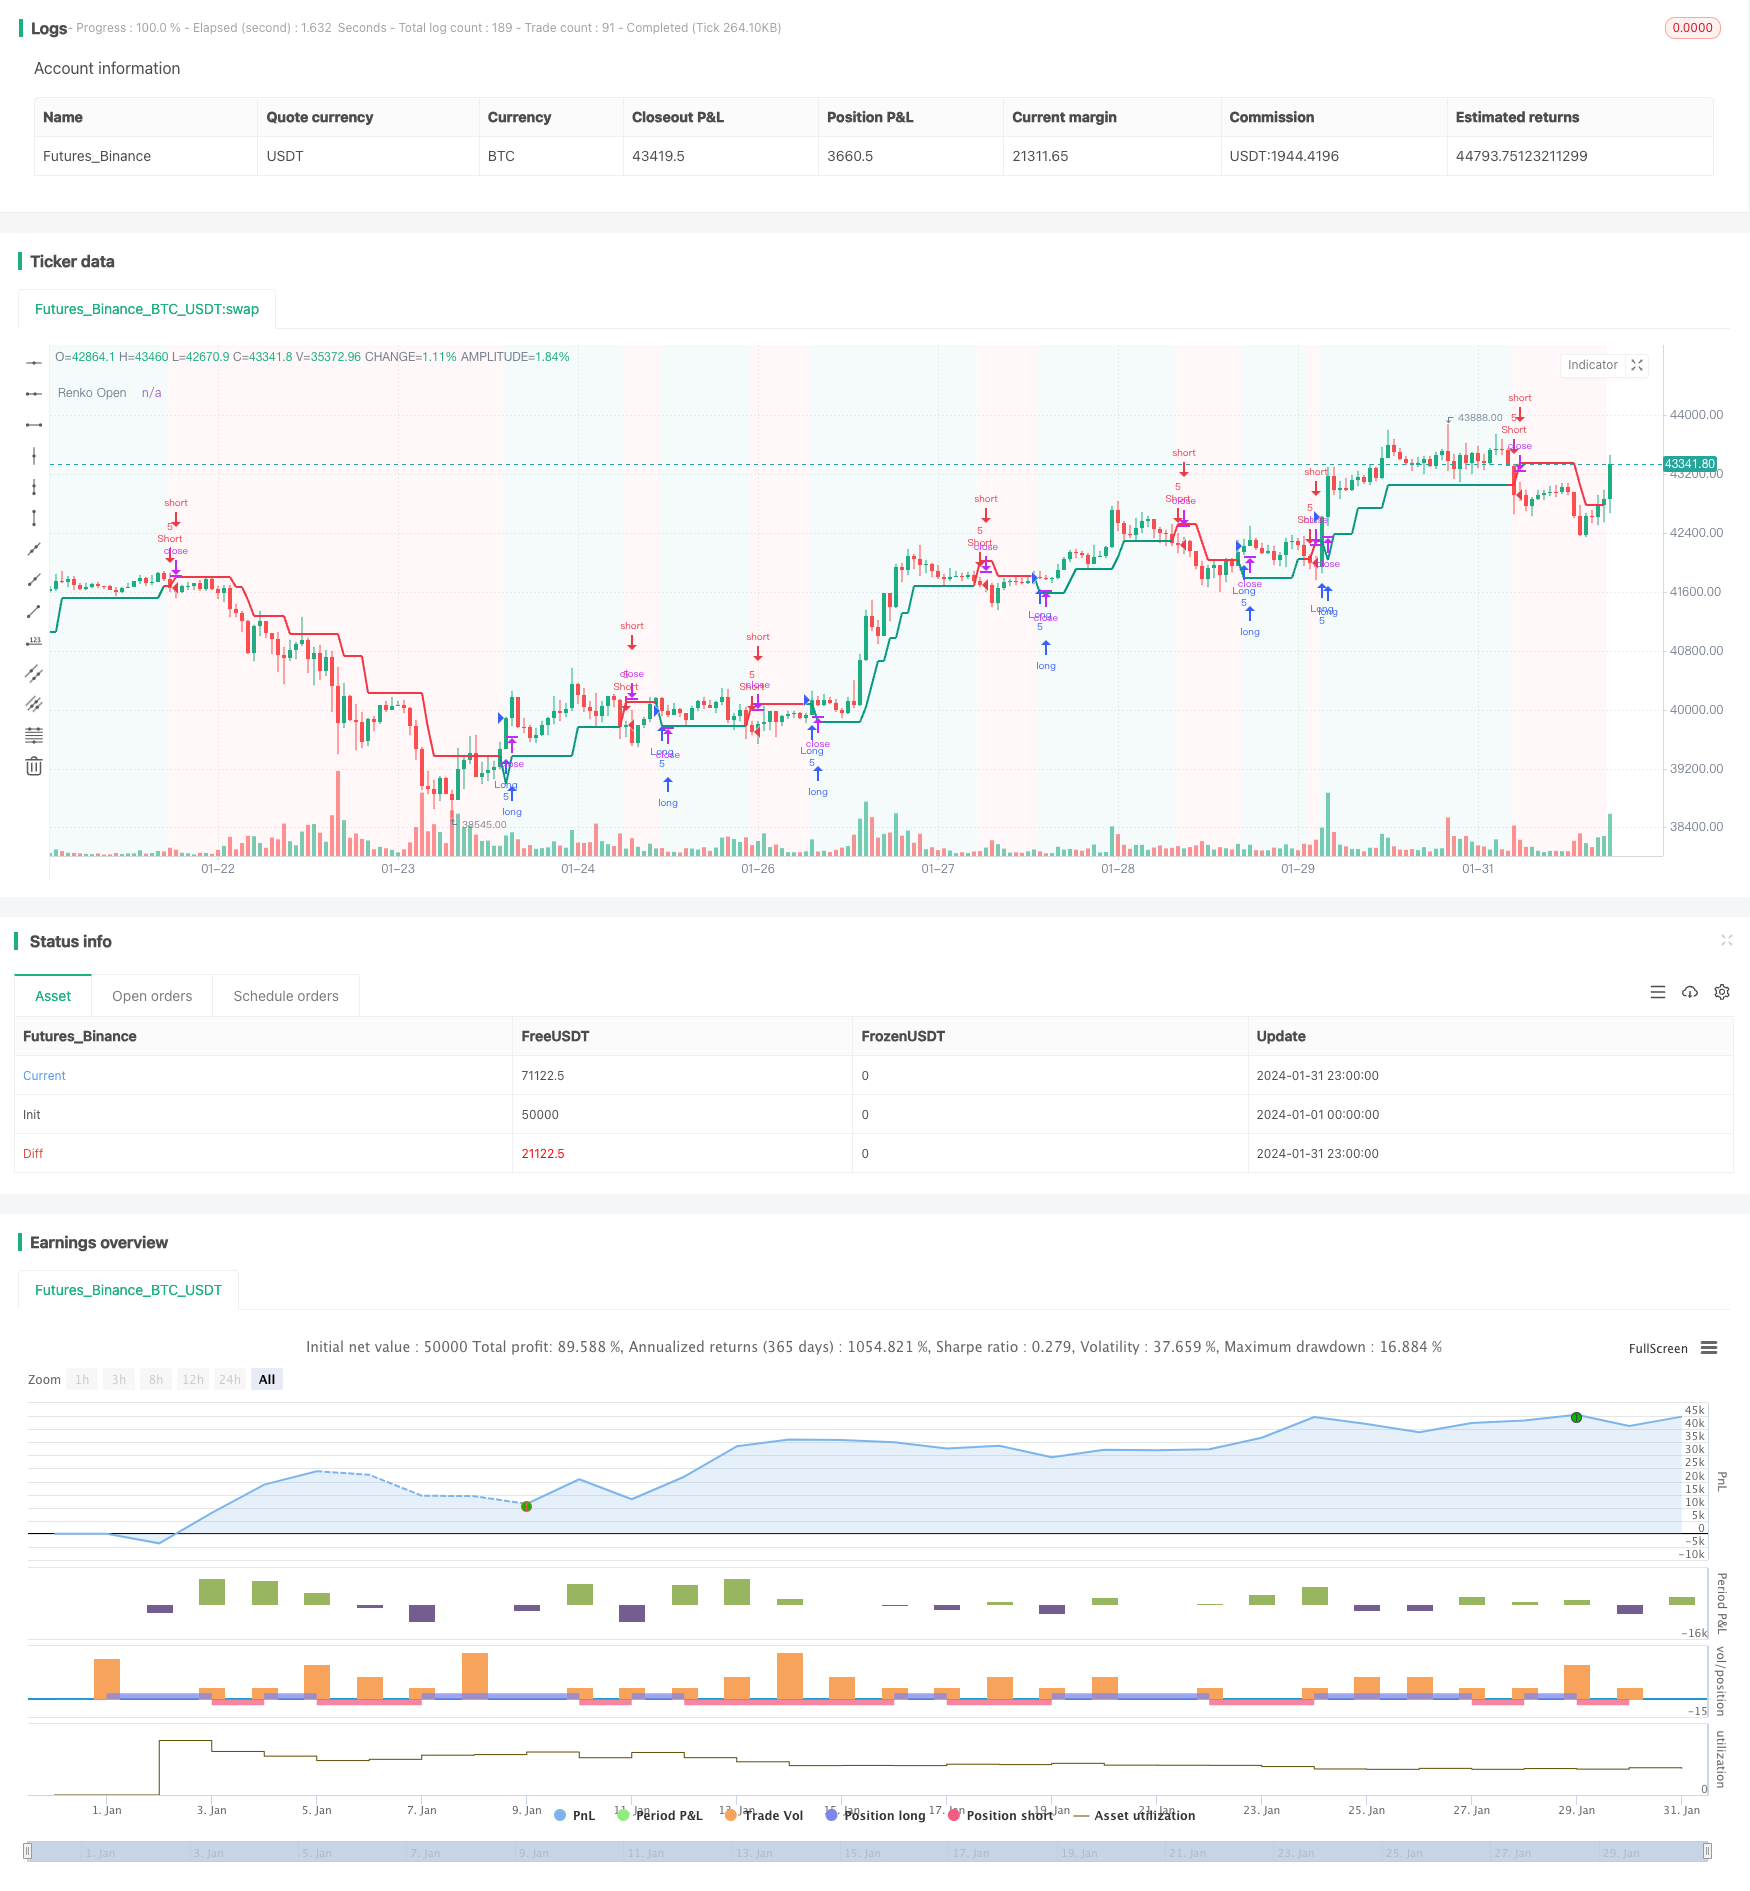
基于Renko平均真实波幅的趋势反转策略成功地利用Renko图表结合ATR指标自动识别金融市场中的转折点。该策略具有消除滞后绘制、自动适应市场波动率以及动态止损止盈等优点。同时,用户也需要警惕参数设置与优化风险,以及突发事件和反转失败的风险。通过多时间周期分析、指标组合以及止盈调整等方式可以继续优化该策略,提高效果。
/*backtest
start: 2024-01-01 00:00:00
end: 2024-01-31 23:59:59
period: 1h
basePeriod: 15m
exchanges: [{"eid":"Futures_Binance","currency":"BTC_USDT"}]
*/

//@version=5
strategy(title='[tradinghook] - Renko Trend Reversal Strategy', shorttitle='[tradinghook] - Renko TRS', overlay=true ,initial_capital = 100, commission_value = 0.05, default_qty_value = 5)

// INPUTS
renkoATRLength = input.int(10, minval=1, title='ATR Length')
stopLossPct = input.float(3, title='Stop Loss Percentage', step=0.1)
takeProfitPct = input.float(20, title='Take Profit Percentage', step=0.1)
startDate = input(timestamp("01 July 2023 00:00"), title="Start Date")
endDate = input(timestamp("31 Dec 2025 23:59"), title="End Date")
enableShorts = input.bool(true, title="Enable Shorts")

var float stopLossPrice = na
var float takeProfitPrice = na

atr = ta.atr(renkoATRLength)

// thanks to https://www.tradingview.com/script/2vKhpfVH-Renko-XZ/ for manually calculating renkoClose and renkoOpen in order to remove repaint
getRenkoClose() =>
    p1 = 0.0
    p1 := close > nz(p1[1]) + atr ? nz(p1[1]) + atr : close < nz(p1[1]) - atr ? nz(p1[1]) - atr : nz(p1[1])
    p1

Renko3() =>
    p3 = 0.0
    p3 := open > nz(p3[1]) + atr ? nz(p3[1]) + atr : open < nz(p3[1]) - atr ? nz(p3[1]) - atr : nz(p3[1])
    p3

getRenkoOpen() =>
    open_v = 0.0
    Br_2 = Renko3()
    open_v := Renko3() != Renko3()[1] ? Br_2[1] : nz(open_v[1])
    open_v

renkoOpen = getRenkoOpen()
renkoClose = getRenkoClose()

// COLORS
colorGreen = #089981
colorRed = #F23645
bgTransparency = 95
bgColorRed = color.new(colorRed, bgTransparency)
bgColorGreen = color.new(colorGreen, bgTransparency)
lineColor = renkoClose < renkoOpen ?  colorRed : colorGreen
bgColor = renkoClose < renkoOpen ?  bgColorRed : bgColorGreen

// PLOTS
plot(renkoOpen, title="Renko Open", style=plot.style_line, linewidth=2, color=lineColor)
bgcolor(bgColor)

// SIGNALS
isWithinTimeRange = true
buySignal = ta.crossunder(renkoOpen, renkoClose) and isWithinTimeRange
sellSignal = ta.crossover(renkoOpen, renkoClose) and isWithinTimeRange and enableShorts

if (buySignal)
    stopLossPrice := renkoOpen * (1 - stopLossPct / 100)
    takeProfitPrice := renkoOpen * (1 + takeProfitPct / 100)
    strategy.entry("Long", strategy.long)
    strategy.exit("ExitLong", "Long", stop = stopLossPrice, limit = takeProfitPrice, comment="SL: " + str.tostring(stopLossPrice) + ", TP: " + str.tostring(takeProfitPrice))
if (sellSignal)
    stopLossPrice := renkoOpen * (1 + stopLossPct / 100)
    takeProfitPrice := renkoOpen * (1 - takeProfitPct / 100)
    strategy.entry("Short", strategy.short)
    strategy.exit("ExitShort", "Short", stop = stopLossPrice, limit = takeProfitPrice, comment="SL: " + str.tostring(stopLossPrice) + ", TP: " + str.tostring(takeProfitPrice))