概述
该策略运用RSI指标与其均线的交叉作为交易信号,属于常见的动量指标策略。其核心原理是追踪RSI指标与RSI的简单移动平均线SMA_RSI之间的差值,再对这个差值计算简单移动平均线SMA_RSI2,当SMA_RSI2上穿阈值时做多,下穿阈值时平仓。
策略原理
该策略使用3个参数计算RSI指标与其两个不同周期的简单移动平均线。首先计算常规RSI指标,周期为length。然后计算RSI的length2周期简单移动平均线SMA_RSI。最后计算RSI与SMA_RSI的差值delta,再对delta计算length3周期的简单移动平均线SMA_RSI2。当SMA_RSI2上穿用户设定的阈值时,进行多头交易;当SMA_RSI2下穿阈值时,平仓头寸。
这样,就构成了基于RSI指标均线交叉的交易策略信号。由于SMA_RSI2是差值delta的均线,能够反映RSI指标的动量和变化趋势,掌握住了RSI指标本身的精髓。
优势分析
该策略结合了RSI指标与其均线的优点,能够顺应价格趋势,避免被噪音误导。采用差值delta再平滑的思路,使得交易信号更加清晰。总体来说,该策略回撤较小,获利稳定。
具体优势如下:
- 运用差值delta平滑价格波动,减少假信号
- 均线交叉形式简单直接,容易掌握
- 可调参数较多,可根据市场调整
- 获利稳定,回撤较小
风险及改进
该策略也存在一些风险,主要体现在:
- 大幅行情中,止损可能较大
- 震荡趋势中容易获利不稳定
可以从以下几个方面进行改进:
- 优化参数,提高稳定性
- 加入止损机制,控制单笔损失
- 与其他指标组合,提升信号质量
总结
本策略整体较为简单通用,通过差值运算增加了RSI指标本身的实用性,利用均线交叉进行判断,回撤控制能力较强,是一种非常实用的动量指标策略。
策略源码
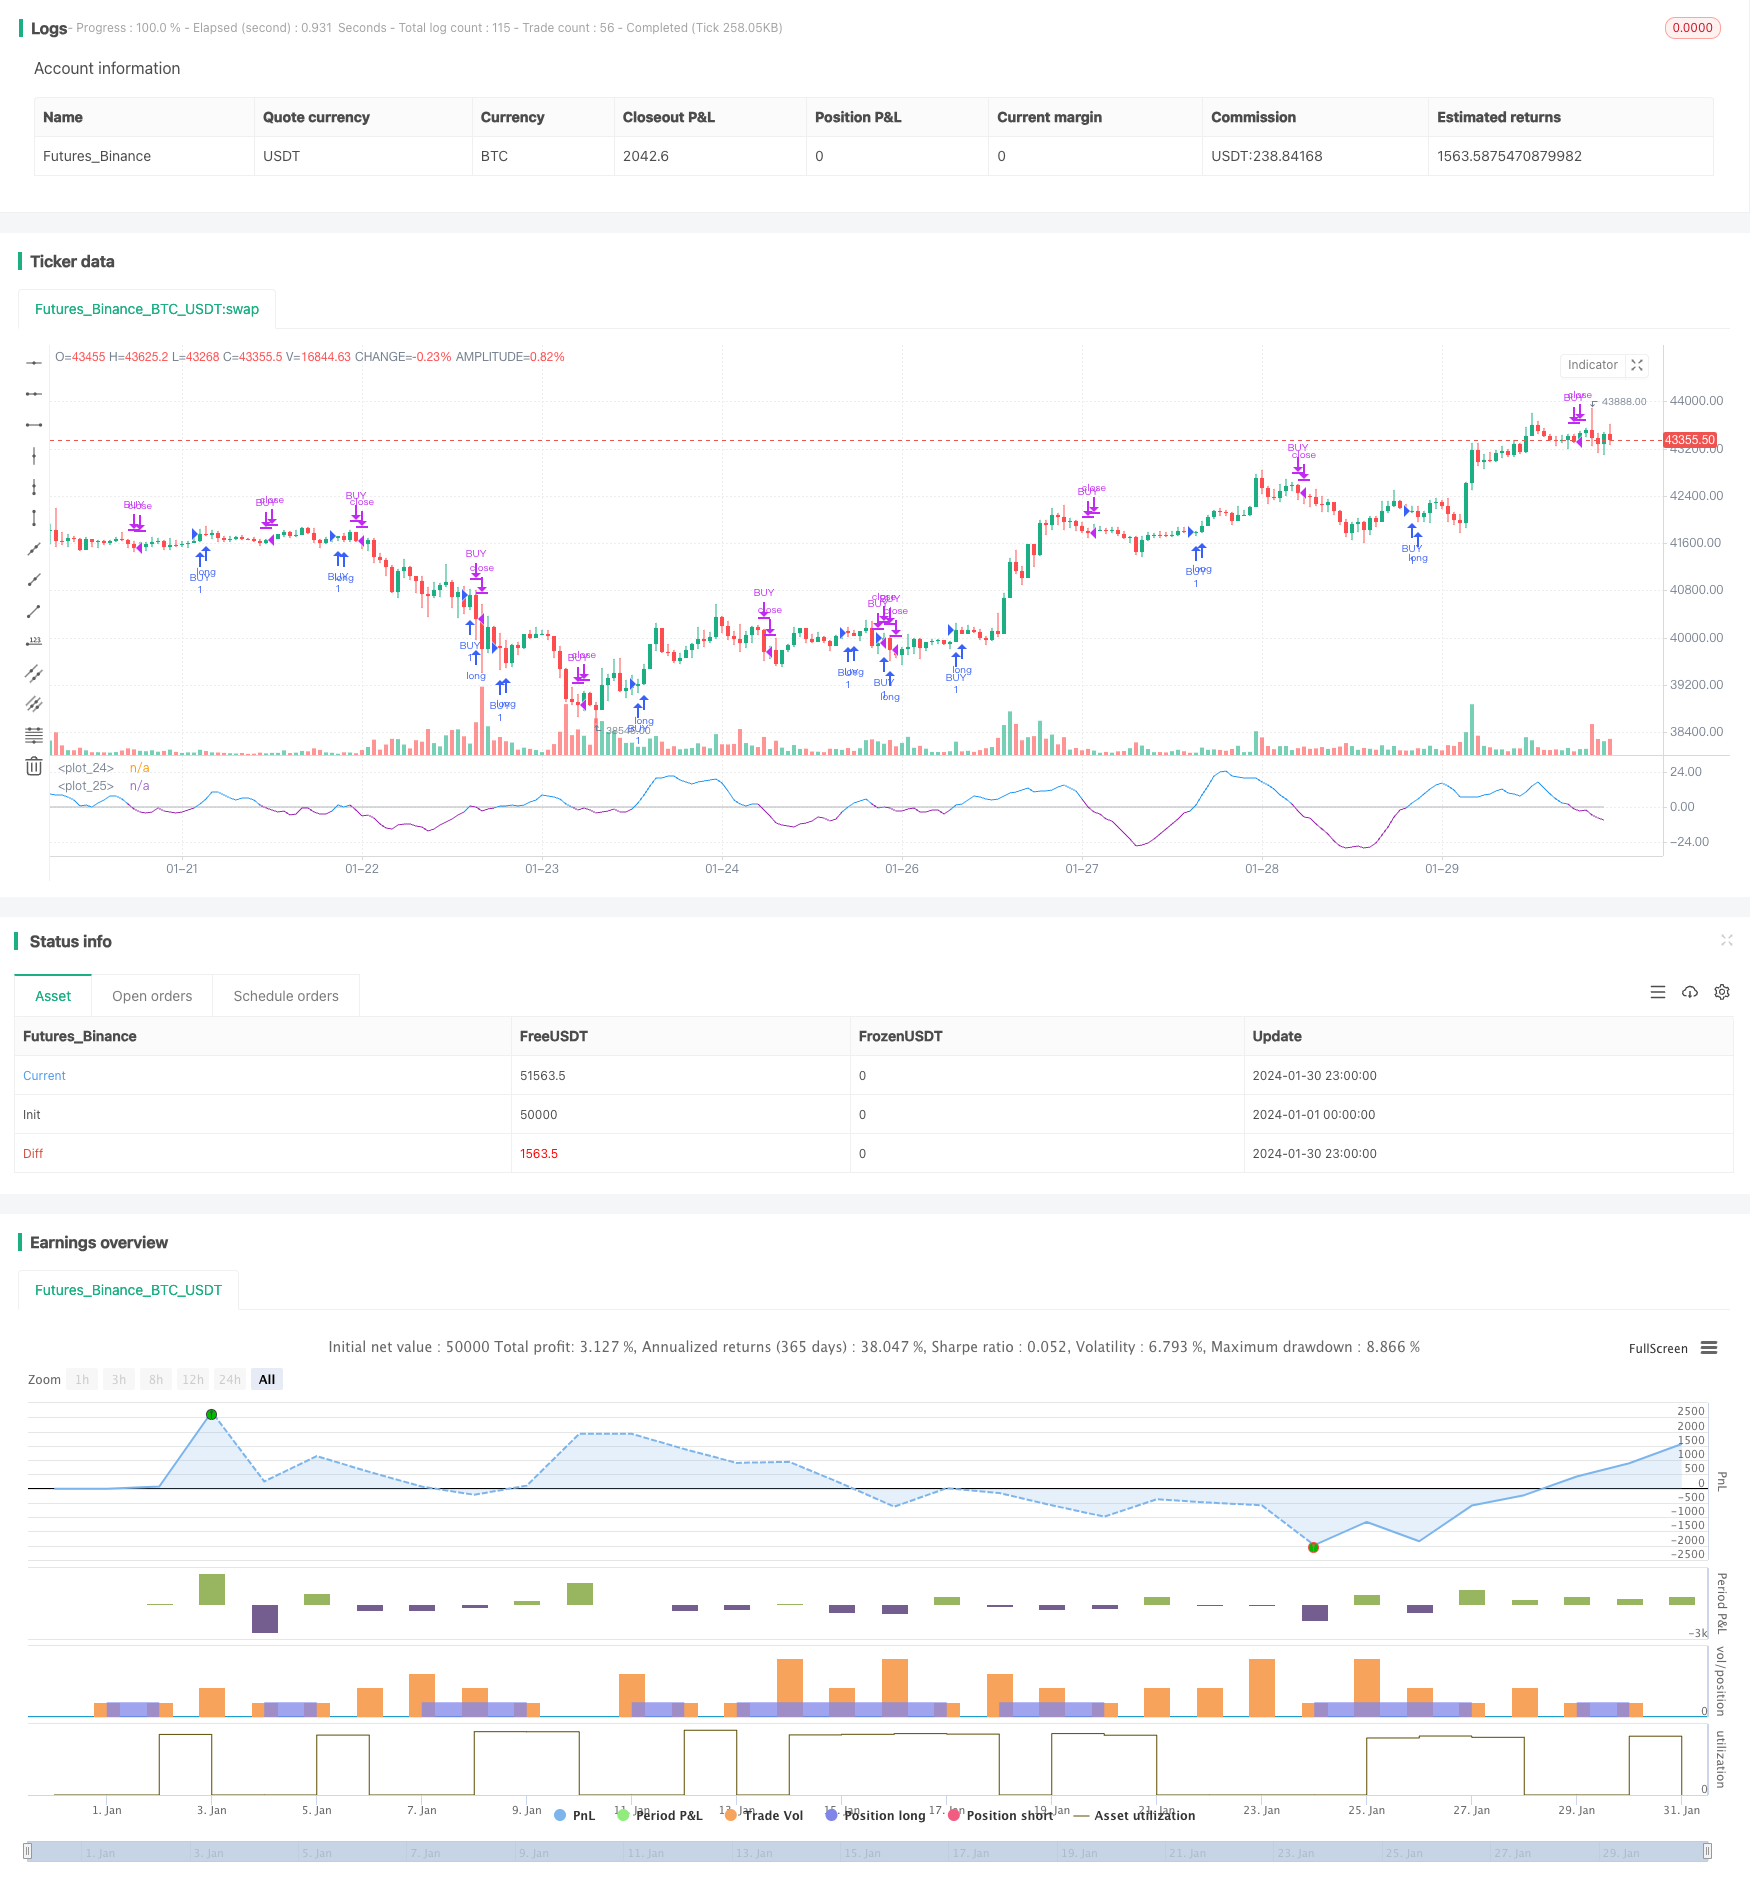
/*backtest
start: 2024-01-01 00:00:00
end: 2024-01-31 00:00:00
period: 1h
basePeriod: 15m
exchanges: [{"eid":"Futures_Binance","currency":"BTC_USDT"}]
*/

//@version=4
strategy ("RSI&SMA", overlay=false )
startP = timestamp(input(2017, "Start Year"), input(12, "Month"), input(17, "Day"), 0, 0)
end   = timestamp((9999), (1), (1), 0, 0)
_testPeriod() => true

length = input(3, minval=1, title = "RSI period")
length2 = input(21, minval=1, title = "RSI SMA-1")
length3 = input(13, minval=1, title = "RSI SMA-2")
threshold  = input(0,step=0.5, title="Threshold")
filter = input(false, title="Use filter?")


up = rma (max (change (close), 0), length)
down = rma (-min (change (close), 0), length)
RSI = down == 0? 100: up == 0? 0: 100-100 / (1 + up / down)

SMA_RSI = sma(RSI, length2)
delta = RSI-SMA_RSI
SMA_RSI2 = sma(delta, length3)
Long = crossover(SMA_RSI2, threshold)
Short = crossunder(SMA_RSI2, threshold)

plot(threshold, color=color.silver)
plot(SMA_RSI2, color= SMA_RSI2 > 0 ? color.blue : color.purple)
//plot(SMA_RSI, color=color.green)
//plot(delta, color=color.red)

long_condition =  Long and (filter ? close > ema(close, 200) : true) and _testPeriod()
strategy.entry('BUY', strategy.long, when=long_condition)

short_condition =  Short
strategy.close('BUY', when=short_condition)