概述
该策略是两个不同策略的组合,第一个策略基于股票价格的双移动平均线穿越形成信号;第二个策略基于威廉姆斯指标中的神奇摆动指标。最终信号取两个策略信号的交集,形成最终交易信号。
策略原理
第一个策略的原理是,当昨日收盘价高于前日收盘价,且快速K线9日随机指标低于慢速D线3日随机指标时产生买入信号;当昨日收盘价低于前日收盘价,且快速K线9日随机指标高于慢速D线3日随机指标时,产生卖出信号。
第二个策略的原理是,计算5日和34日价格波动的差值,并计算该差值的移动平均线。当当前值高于前一周期时为买入信号,当当前值低于前一周期时为卖出信号。
结合两个策略,最终信号取两个策略信号的交集。当两个策略同时发出买入信号时,做多;当两个策略同时发出卖出信号时,做空。
优势分析
该策略结合了双移动平均线策略和威廉姆斯指标策略两个策略的优势。双移动平均线策略可以抓取中长线趋势;威廉姆斯指标策略可以捕捉短线交易机会。组合两个策略,可以同时兼顾获利和防止假突破。
另外,该策略采用多个参数输入设定,可以根据不同股票和行情进行参数优化,适应更广泛的市场环境。
风险分析
该策略最大的风险在于两个策略信号可能不一致。当一个策略发出买入信号而另一个发出卖出信号时,该策略无法产生有效信号,可能错过交易机会。
此外,该策略包含多个参数,这给参数优化带来一定难度。不合适的参数组合可能导致策略表现不佳。
为降低风险,可以考虑只采用其中一个策略信号;或者研究确定适合不同市场环境的参数范围。
优化方向
该策略可以从以下几个方面进行优化:
评估两个策略信号的一致性,研究在不同参数下其信号匹配程度,确定最佳参数组合。
测试该策略在不同品种和不同周期下的表现,寻找最佳适用范围。
可以考虑将双移动平均线策略改为其他指标,如KDJ指标等,丰富策略组合。
增加止损机制,以控制危险,例如设定最大回撤止损。
总结
该策略结合双移动平均线策略和威廉姆斯指标策略,同时兼顾趋势跟踪和短线信号捕捉。通过参数优化可以适应较广泛的市场环境。但其中也存在信号匹配度不一致带来的风险以及复杂参数优化的难点。总体来说,该策略为量化交易提供了一种有效的思路,值得进一步研究优化,以减小风险和提高稳定性。
/*backtest
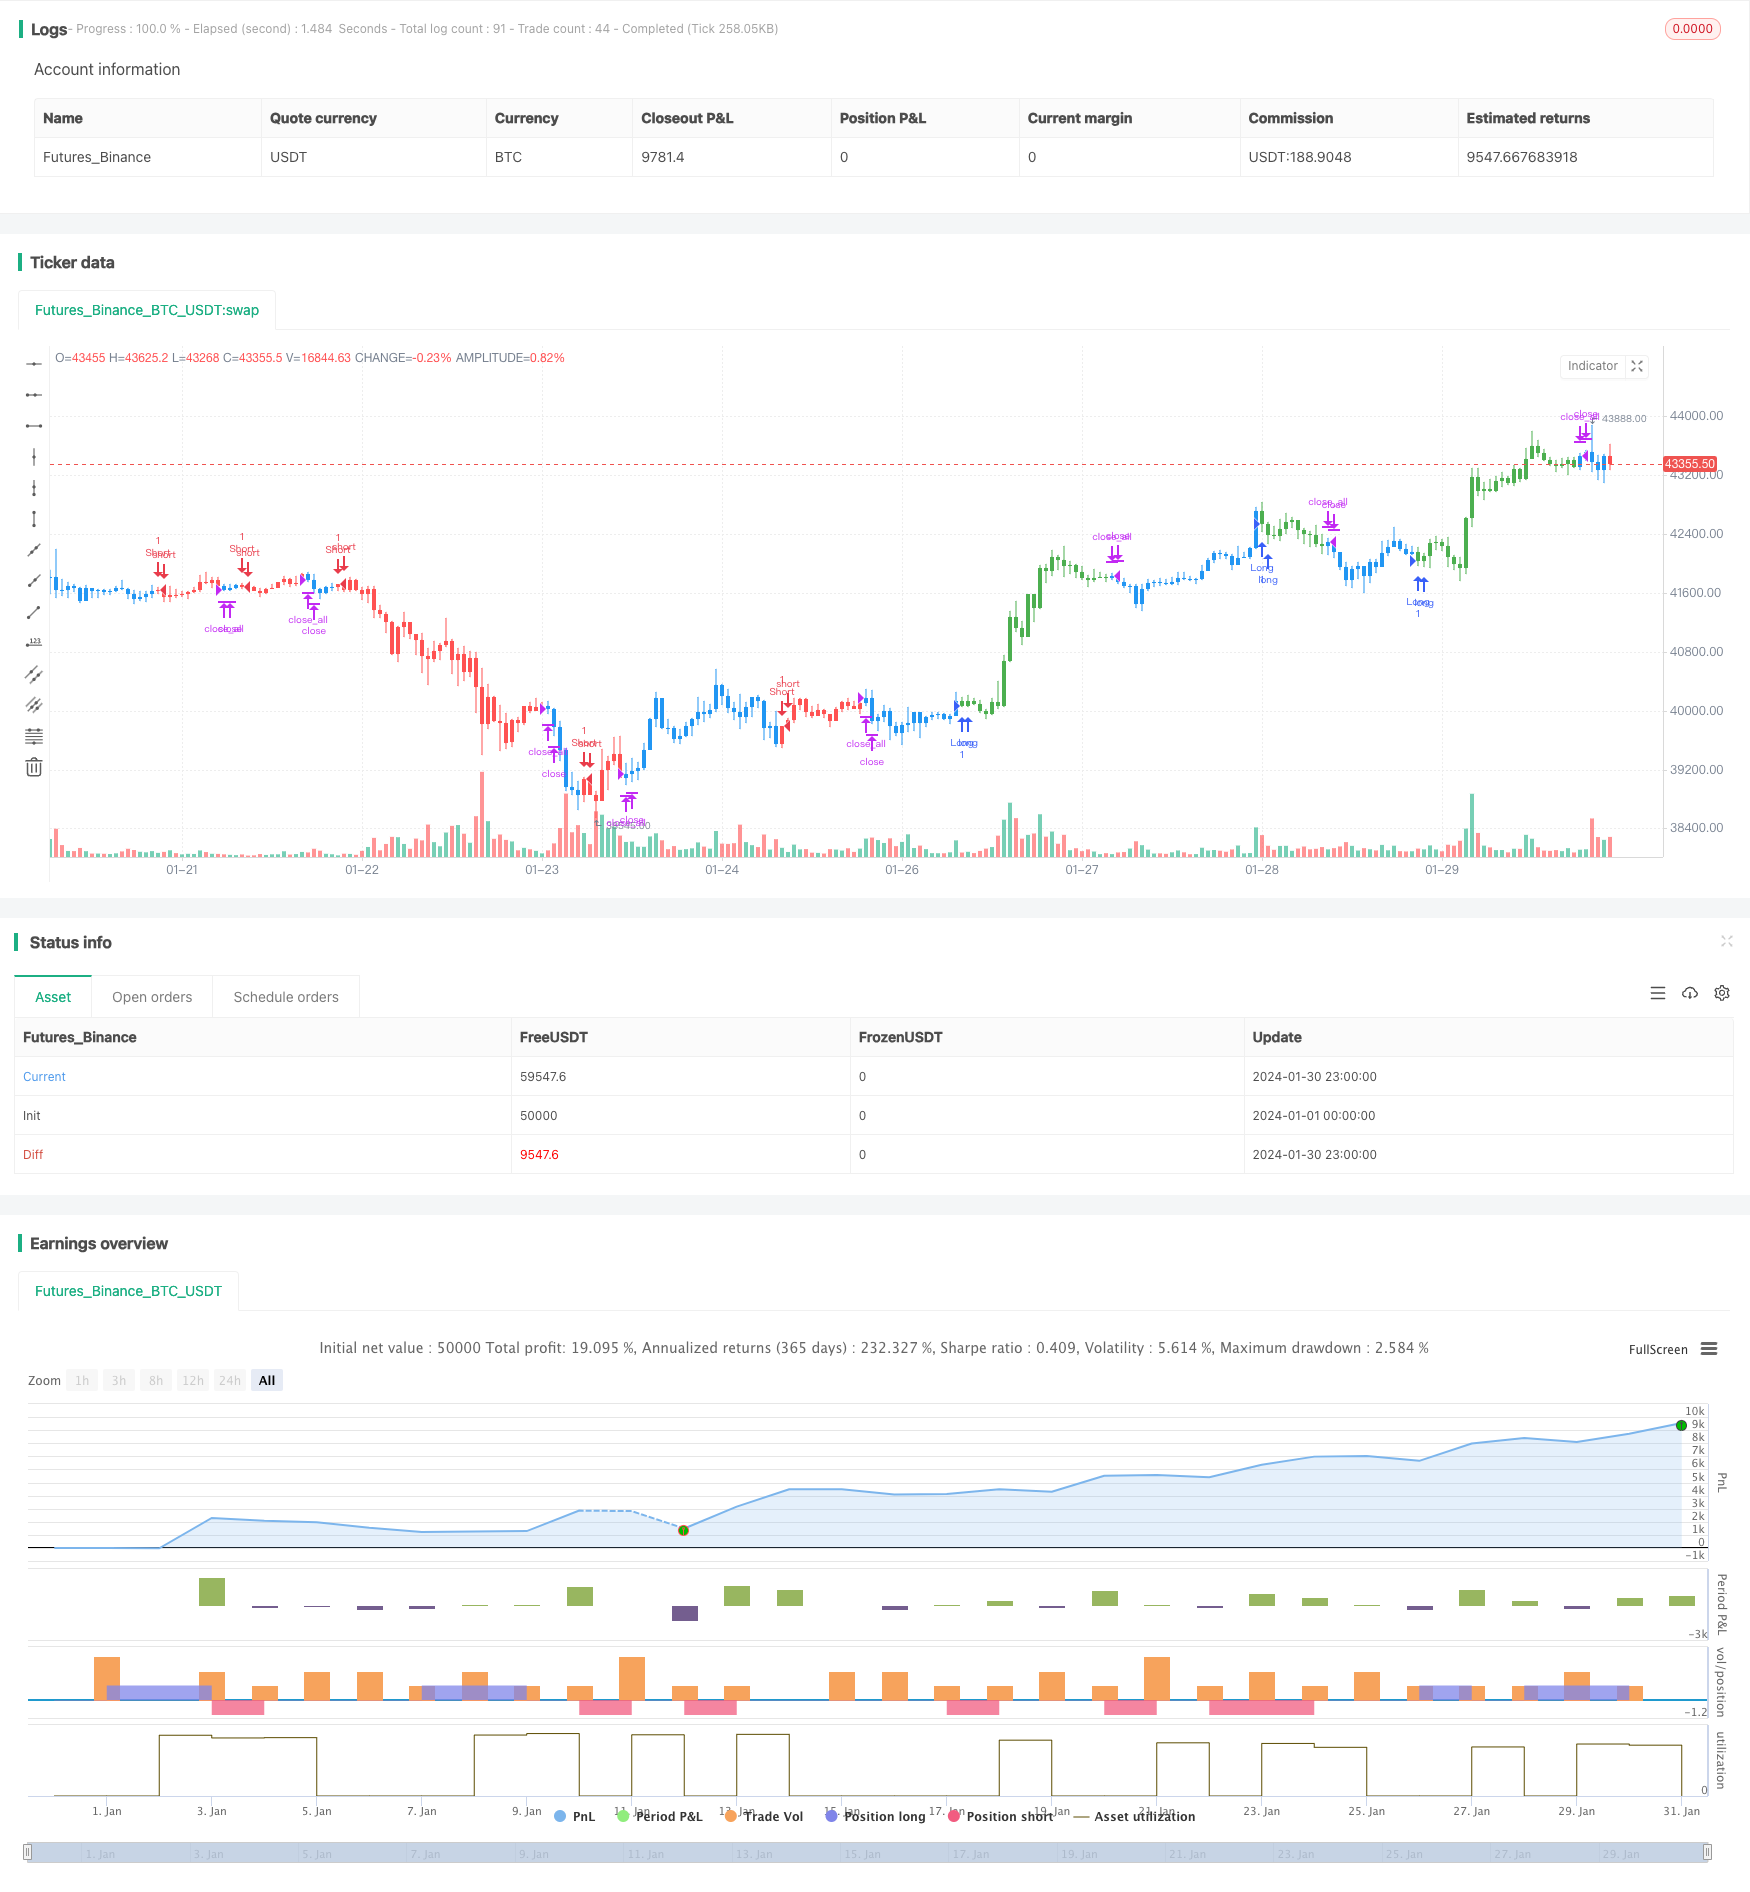
start: 2024-01-01 00:00:00
end: 2024-01-31 00:00:00
period: 1h
basePeriod: 15m
exchanges: [{"eid":"Futures_Binance","currency":"BTC_USDT"}]
*/
//@version=3
////////////////////////////////////////////////////////////
// Copyright by HPotter v1.0 20/06/2019
// This is combo strategies for get a cumulative signal.
//
// First strategy
// This System was created from the Book "How I Tripled My Money In The
// Futures Market" by Ulf Jensen, Page 183. This is reverse type of strategies.
// The strategy buys at market, if close price is higher than the previous close
// during 2 days and the meaning of 9-days Stochastic Slow Oscillator is lower than 50.
// The strategy sells at market, if close price is lower than the previous close price
// during 2 days and the meaning of 9-days Stochastic Fast Oscillator is higher than 50.
//
// Second strategy
// This indicator plots the oscillator as a histogram where blue denotes
// periods suited for buying and red . for selling. If the current value
// of AO (Awesome Oscillator) is above previous, the period is considered
// suited for buying and the period is marked blue. If the AO value is not
// above previous, the period is considered suited for selling and the
// indicator marks it as red.
// You can make changes in the property for set calculating strategy MA, EMA, WMA
//
// WARNING:
// - For purpose educate only
// - This script to change bars colors.
////////////////////////////////////////////////////////////
Reversal123(Length, KSmoothing, DLength, Level) =>
vFast = sma(stoch(close, high, low, Length), KSmoothing)
vSlow = sma(vFast, DLength)
pos = 0.0
pos := iff(close[2] < close[1] and close > close[1] and vFast < vSlow and vFast > Level, 1,
iff(close[2] > close[1] and close < close[1] and vFast > vSlow and vFast < Level, -1, nz(pos[1], 0)))
pos
BillWilliamsAC(nLengthSlow, nLengthFast,nLengthMA, nLengthEMA, nLengthWMA, bShowWMA, bShowMA, bShowEMA) =>
pos = 0
xSMA1_hl2 = sma(hl2, nLengthFast)
xSMA2_hl2 = sma(hl2, nLengthSlow)
xSMA1_SMA2 = xSMA1_hl2 - xSMA2_hl2
xSMA_hl2 = sma(xSMA1_SMA2, nLengthFast)
nRes = xSMA1_SMA2 - xSMA_hl2
xResWMA = wma(nRes, nLengthWMA)
xResMA = sma(nRes, nLengthMA)
xResEMA = ema(nRes, nLengthEMA)
xSignalSeries = iff(bShowWMA, xResWMA,
iff(bShowMA, xResMA,
iff(bShowEMA, xResEMA, na)))
cClr = nRes > nRes[1] ? blue : red
pos := iff(xSignalSeries[2] < 0 and xSignalSeries[1] > 0, 1,
iff(xSignalSeries[2] > 0 and xSignalSeries[1] < 0, -1, nz(pos[1], 0)))
pos
strategy(title="Combo Backtest 123 Reversal & Bill Williams. Awesome Oscillator (AC) with Signal Line", shorttitle="Combo", overlay = true)
Length = input(14, minval=1)
KSmoothing = input(1, minval=1)
DLength = input(3, minval=1)
Level = input(50, minval=1)
//-------------------------
nLengthSlow = input(34, minval=1, title="Length Slow")
nLengthFast = input(5, minval=1, title="Length Fast")
nLengthMA = input(15, minval=1, title="MA")
nLengthEMA = input(15, minval=1, title="EMA")
nLengthWMA = input(15, minval=1, title="WMA")
bShowWMA = input(type=bool, defval=true, title="Show and trading WMA")
bShowMA = input(type=bool, defval=false, title="Show and trading MA")
bShowEMA = input(type=bool, defval=false, title="Show and trading EMA")
reverse = input(false, title="Trade reverse")
posReversal123 = Reversal123(Length, KSmoothing, DLength, Level)
posBillWilliamsAC = BillWilliamsAC(nLengthSlow, nLengthFast,nLengthMA, nLengthEMA, nLengthWMA, bShowWMA, bShowMA, bShowEMA)
pos = iff(posReversal123 == 1 and posBillWilliamsAC == 1 , 1,
iff(posReversal123 == -1 and posBillWilliamsAC == -1, -1, 0))
possig = iff(reverse and pos == 1, -1,
iff(reverse and pos == -1, 1, pos))
if (possig == 1)
strategy.entry("Long", strategy.long)
if (possig == -1)
strategy.entry("Short", strategy.short)
if (possig == 0)
strategy.close_all()
barcolor(possig == -1 ? red: possig == 1 ? green : blue )