Moving Average and Stochastic Trading Strategy

Overview
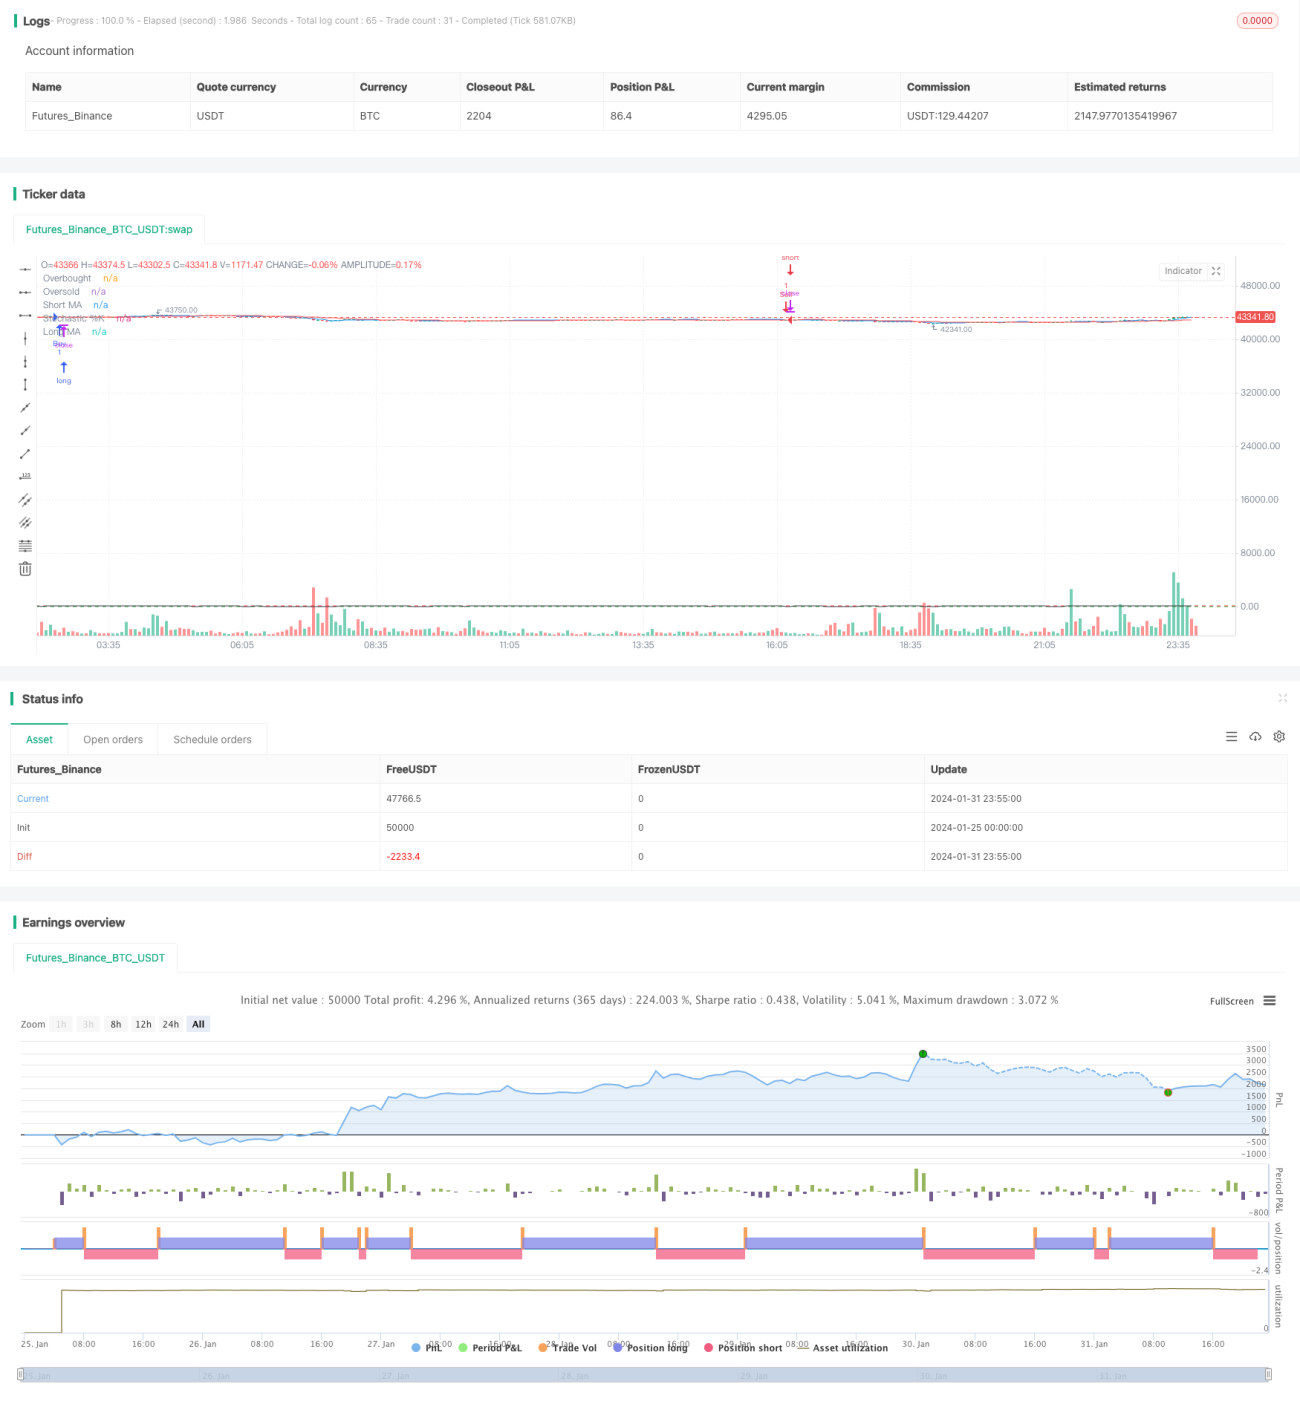
This strategy combines moving averages and the Stochastic oscillator to implement an automated stock trading system. It uses two moving averages of different lengths and the Stochastic indicator to capture trend and overbought/oversold signals, and makes buy and sell decisions based on the trend direction and indicator signals in overbought/oversold regions.
Strategy Logic
1. Moving Averages
A fast line (5-day) and slow line (20-day) moving average are used. The fast line crossing above the slow line is a buy signal, while crossing below is a sell signal. The moving averages determine the price trend and direction.
2. Stochastic Oscillator
The Stochastic parameters are set to: K line period of 14, K line smooth period of 3, D line smooth period of 3. Below 20 on the K line is the oversold region, while above 80 is the overbought region. The Stochastic oscillator determines whether it is in overbought/oversold regions.
3. Entry Rules
Buy condition: Fast MA crossover above slow MA and K line <20 (oversold region)
Sell condition: Fast MA crossover below slow MA and K line >80 (overbought region)
Go long when the buy condition is met; go short when the sell condition is met.
4. Stop Loss Settings
Set 1% profit target after buying; set 1% stop loss after selling.
Advantage Analysis
This strategy combines trend and indicators to effectively capture medium-to-long term price trends, while using the Stochastic oscillator to control the timing of trades and avoid random entries without a clear directional bias. The strategy parameters are adjustable to different market environments. Overall this strategy works very well on large/mid-cap stocks in uptrends.
Risks and Solutions
-
Price spikes from significant news events may incur large losses. Stop losses can control the risk.
-
Sustained range-bound markets may lead to consecutive small losses. Adjust the MA periods to reduce losses.
-
Avoid key market periods when prices tend to reverse.
Optimization
-
Test different parameter combinations to find optimal parameters, such as different MA lengths.
-
Incorporate other analysis tools like volume, volatility for filter conditions to improve profit rate.
-
Research stock selection mechanisms, like picking strong stocks or cap-weighted indices, to reduce single-stock risks.
Conclusion
The overall strategy operates smoothly. With stop losses and profit targets, the overall profit/loss profile is solid. Further improvements can be expected from parameter tuning and stock pool filtering. In general this is an easy-to-implement and robust quantitative trading strategy.
- 1