概述
本文将介绍一个结合帕罗贝尔周期指标与布林带指标,设定移动止损策略的量化交易策略。该策略通过计算帕罗贝尔周期线以判断市场趋势方向,再利用布林带上轨与下轨动态设定止损位,从而实现移动止损以锁定利润。
策略原理
首先,该策略利用帕罗贝尔指标判断当前市场趋势。当今日收盘价上穿昨日的帕罗贝尔周期线时,认为行情反转为看涨,可以做多;当今日收盘价下穿昨日周期线时,则行情看跌,可以做空。
其次,该策略结合布林带指标设定动态的止损位。布林带中的上轨可以看作是超买区,下轨为超卖区。当做多后,如果价格重新跌破布林带下轨,则止损平仓;当做空后,如果价格重新涨破上轨,则止损出场。这样,布林带上下轨就成为移动的止损线。
通过上述原理,该策略实现了判断市场方向的同时,又设置了动态的止损机制来跟踪利润。这使其可以在大趋势中捕捉部分涨跌幅,同时也可以通过止损来锁定利润,规避风险。
策略优势
相较于传统止损策略只设定一个固定的止损位,该策略运用布林带指标作为止损线,使止损线可以随价格波动进行移动。这使其可以在比较大的行情中锁定更多利润。此外,相较于单一使用帕罗贝尔周期线,该策略增加布林带指标判断超买超卖区域,可以更加准确。
风险及解决
该策略主要风险在于帕罗贝尔指标判断的趋势性并不强。在震荡行情中,价格可能多次上下穿越帕罗贝尔周期线,使策略产生频繁但微利的交易。此时,交易费用和滑点成本可能会占较大比例,降低策略盈利能力。
为应对上述风险,可以考虑调整参数,增大帕罗贝尔周期线的变化程度,降低误判概率;或者结合其他指标过滤入场时机。例如可加入震荡指标等判断行情是趋势性还是震荡,以减少不必要交易。
策略优化
本策略可以从以下几个方面进行优化:
优化帕罗贝尔指标参数,调整参数指标变化速度,降低误判概率
增加其他技术指标过滤,例如加入MACD,KD等判断行情类型,避免震荡市场的套利
优化布林带参数,调整带宽参数,使布林带更贴近价格变化
增加量能指标,例如交易量,持仓量等辅助判断,避免假突破
结合股票基本面信息,避免影响策略持仓股业绩出现问题
总结
本策略通过帕罗贝尔指标判断市场趋势方向与力度,再利用布林带上下轨作为移动止损位设定止损策略,实现了趋势跟踪与风险控制的结合。相较于传统固定止损策略,本策略可以在较大行情中获得更高收益。通过参数优化与增加其他辅助判断指标,可以进一步增强策略稳定性与减少不必要交易。
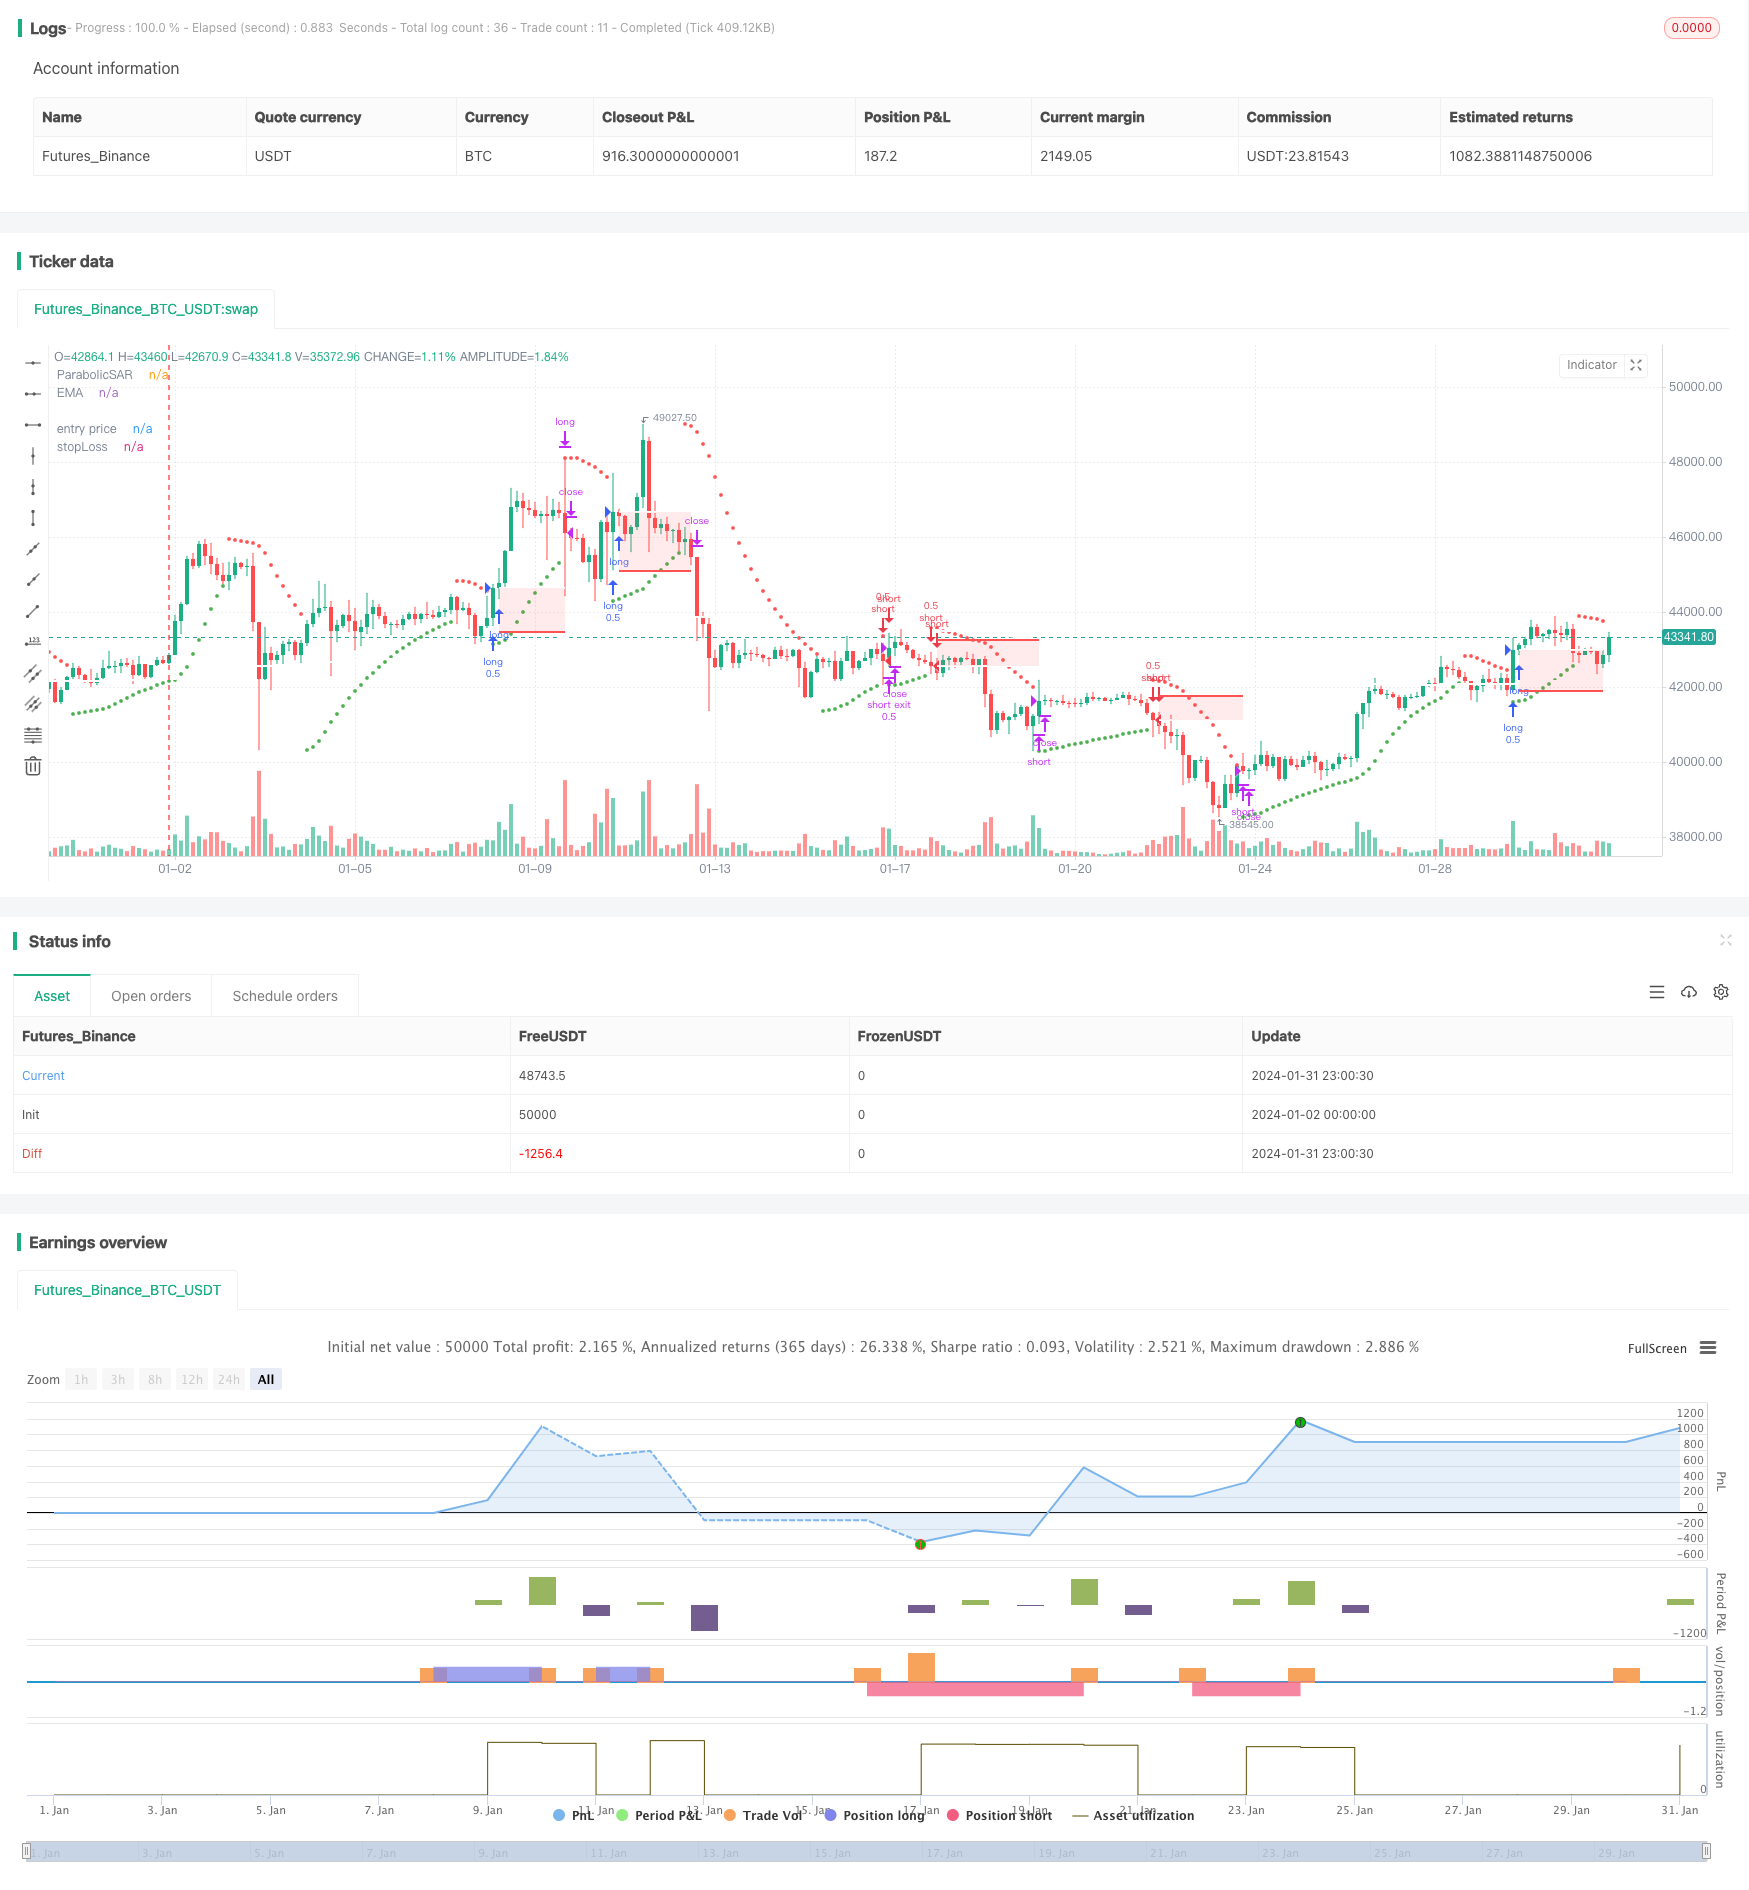
/*backtest
start: 2024-01-02 00:00:00
end: 2024-02-01 00:00:00
period: 3h
basePeriod: 15m
exchanges: [{"eid":"Futures_Binance","currency":"BTC_USDT"}]
*/

// This source code is subject to the terms of the Mozilla Public License 2.0 at https://mozilla.org/MPL/2.0/
// © maxencetajet

//@version=5
strategy("HA_RSI", overlay=true, initial_capital=1000, default_qty_type=strategy.fixed, default_qty_value=0.5, slippage=25)

closeHA = request.security(ticker.heikinashi(syminfo.tickerid), timeframe.period, close)

useDateFilter = input.bool(true, title="Filter Date Range of Backtest",
     group="Backtest Time Period")
backtestStartDate = input(timestamp("5 June 2022"),
     title="Start Date", group="Backtest Time Period",
     tooltip="This start date is in the time zone of the exchange " +
     "where the chart's instrument trades. It doesn't use the time " +
     "zone of the chart or of your computer.")
backtestEndDate = input(timestamp("5 July 2022"),
     title="End Date", group="Backtest Time Period",
     tooltip="This end date is in the time zone of the exchange " +
     "where the chart's instrument trades. It doesn't use the time " +
     "zone of the chart or of your computer.")

inTradeWindow = true

swingHighV = input.int(10, title="Swing High", group="number of past candles")
swingLowV = input.int(10, title="Swing Low", group="number of past candles")

emaV = input.int(200, title="Ema Period", group="EMA")

rsiV = input.int(14, title="RSI Period", group="RSI")

start = input(0.02, group="Parabolic SAR")
increment = input(0.02, group="Parabolic SAR")
maximum = input(0.2, "Max Value", group="Parabolic SAR")

ema = ta.ema(closeHA, emaV)
rsi = ta.rsi(closeHA, rsiV)
SAR = ta.sar(start, increment, maximum)

myColor = SAR < low?color.green:color.red

longcondition = closeHA > ema and rsi > 50 and closeHA[1] > SAR and closeHA[1] < SAR[1]
shortcondition = closeHA < ema and rsi < 50 and closeHA[1] < SAR and closeHA[1] > SAR[1]

float risk_long = na
float risk_short = na
float stopLoss = na
float entry_price = na
float takeProfit = na

risk_long := risk_long[1]
risk_short := risk_short[1]

swingHigh = ta.highest(closeHA, swingHighV)
swingLow = ta.lowest(closeHA, swingLowV)

if strategy.position_size == 0 and longcondition and inTradeWindow
    risk_long := (close - swingLow) / close
    strategy.entry("long", strategy.long, comment="Buy")

if strategy.position_size == 0 and shortcondition and inTradeWindow
    risk_short := (swingHigh - close) / close
    strategy.entry("short", strategy.short, comment="Sell")

if strategy.position_size > 0

    stopLoss := strategy.position_avg_price * (1 - risk_long)
    entry_price := strategy.position_avg_price
    strategy.exit("long exit", "long", stop = stopLoss)

if strategy.position_size < 0

    stopLoss := strategy.position_avg_price * (1 + risk_short)
    entry_price := strategy.position_avg_price
    strategy.exit("short exit", "short", stop = stopLoss)

if closeHA[1] < SAR and close > strategy.position_avg_price
    strategy.close("long", comment="Exit Long")

if closeHA[1] > SAR and close < strategy.position_avg_price
    strategy.close("short", comment="Exit Short")

p_ep = plot(entry_price, color=color.new(color.white, 0), linewidth=2, style=plot.style_linebr, title='entry price')
p_sl = plot(stopLoss, color=color.new(color.red, 0), linewidth=2, style=plot.style_linebr, title='stopLoss')
fill(p_sl, p_ep, color.new(color.red, transp=85))

plot(SAR, "ParabolicSAR", style=plot.style_circles, color=myColor, linewidth=1)
plot(ema, color=color.white, linewidth=2, title="EMA")