概述
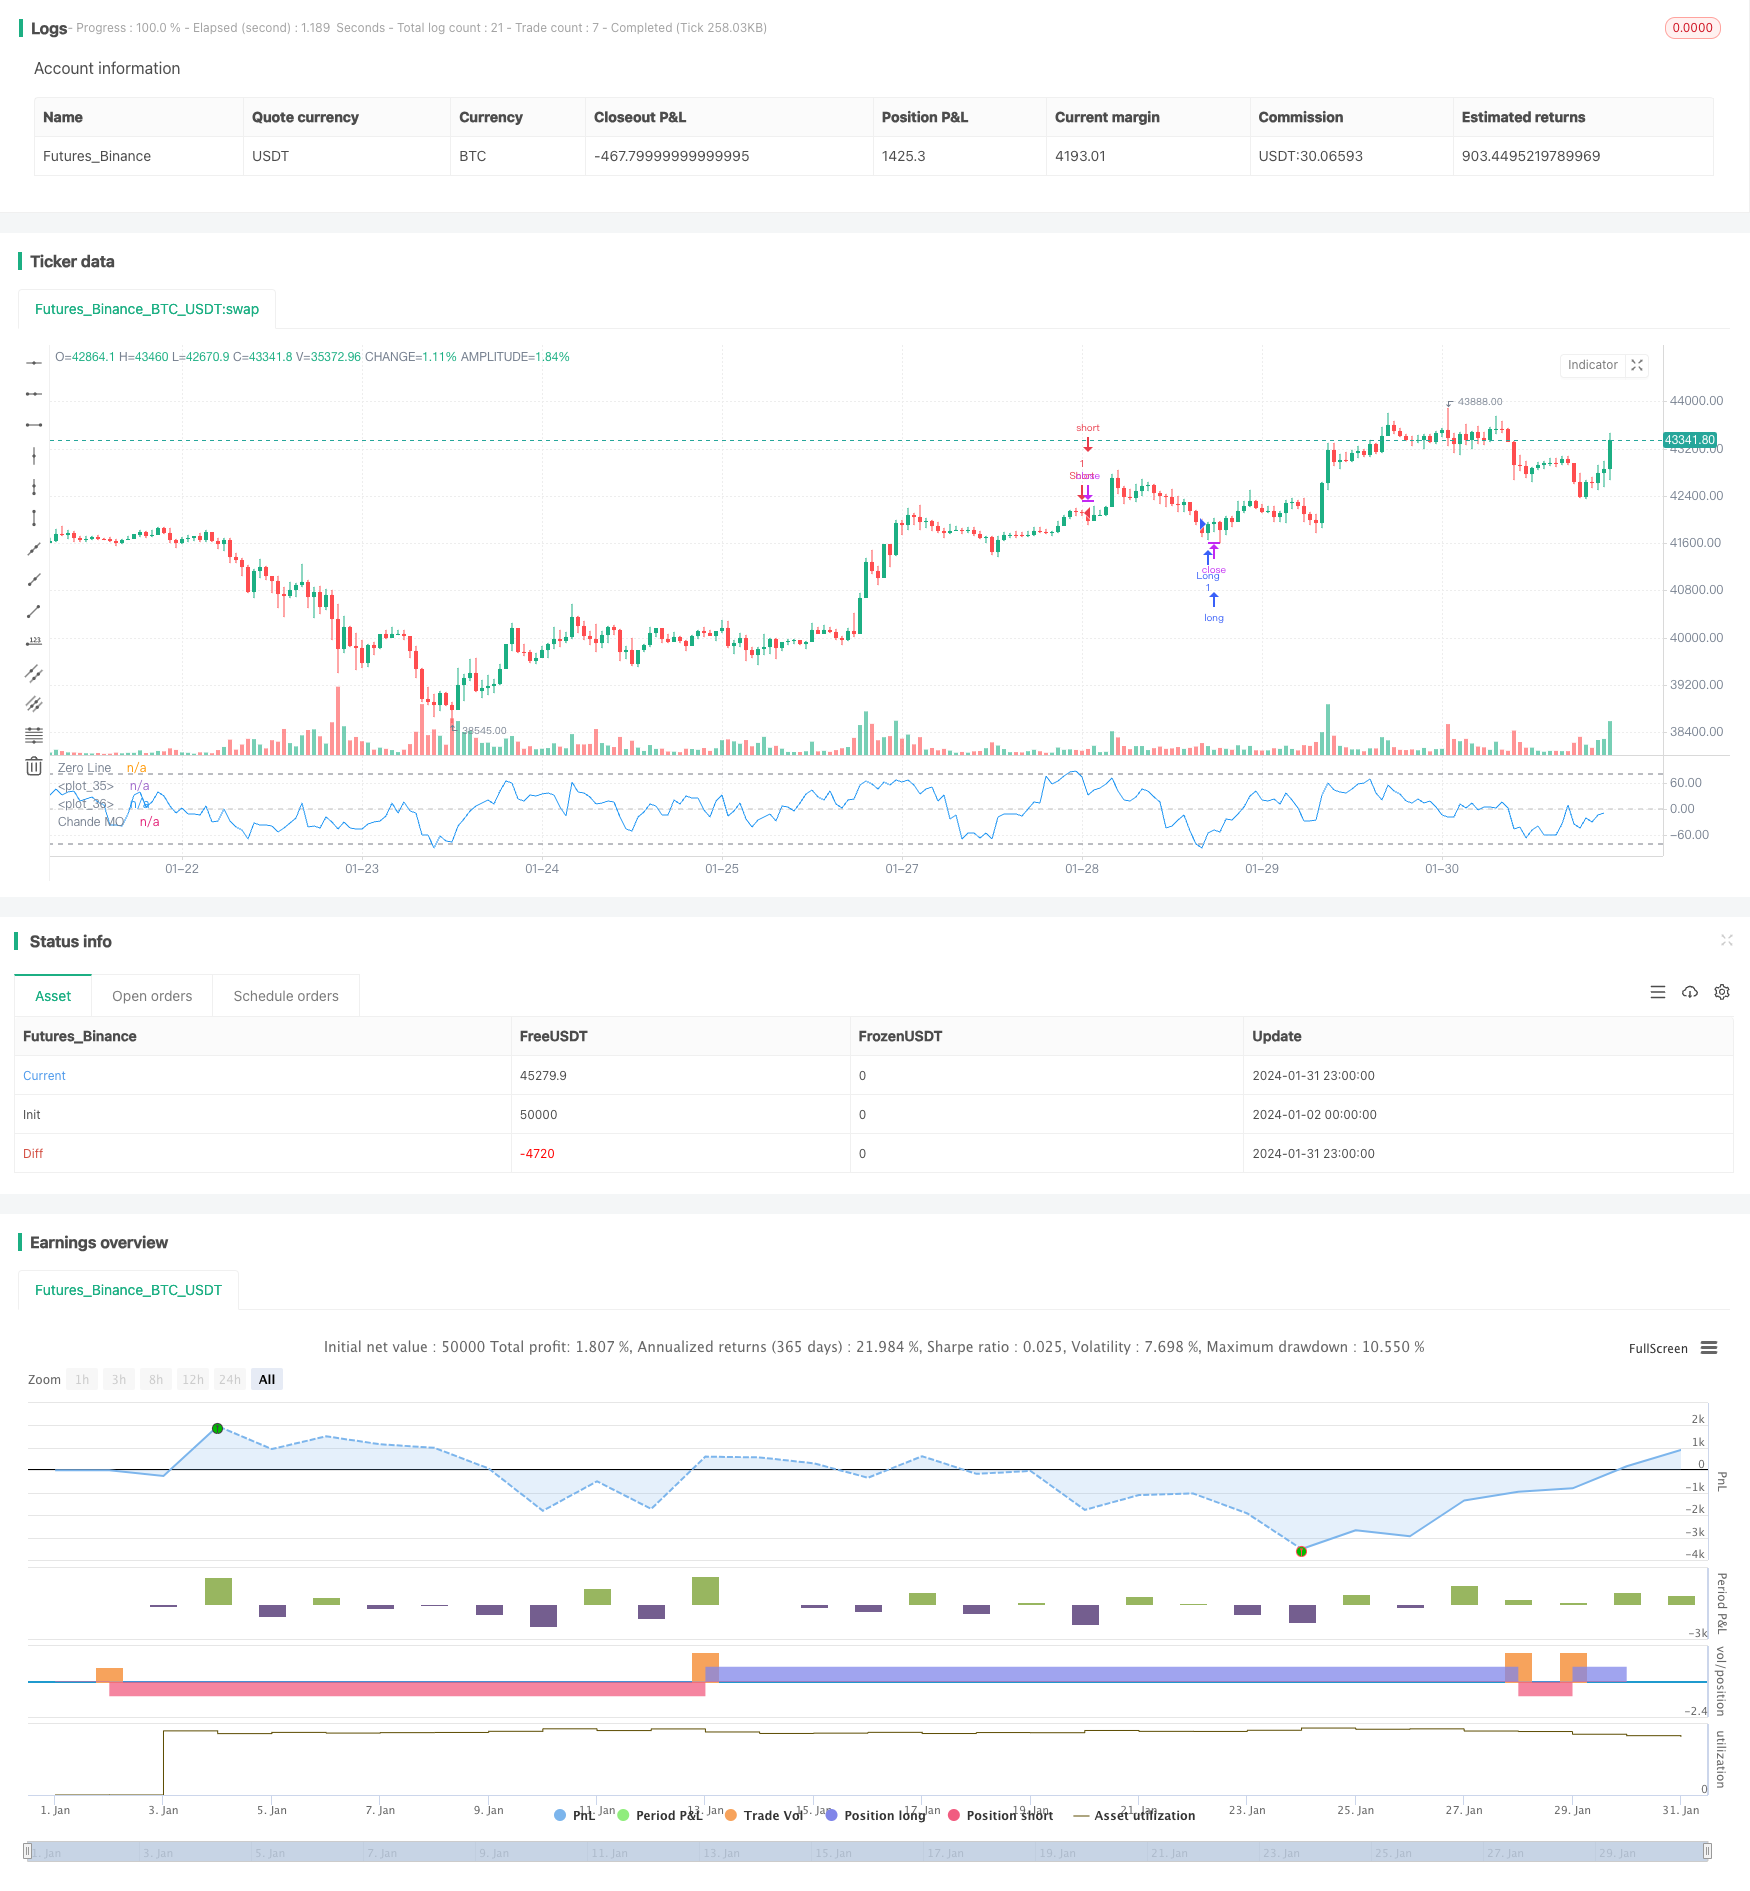
单均点横盘突破策略是一种基于Chande动量指标的量化交易策略。该策略通过计算价格的动量变化,判断市场是否处于横盘整理阶段。当Chande动量指标线突破设定的买入线或卖出线时,进行相应的买入或卖出操作。
策略原理
该策略首先计算价格的动量变化momm,然后将其分为正动量m1和负动量m2。接着计算一定周期内的正负动量之和sm1和sm2,最后得到Chande动量指标chandeMO。该指标以0为中轴,当指标大于0时表示上涨力量大于下跌力量,小于0时则相反。
当Chande动量指标从低位突破买入线时,表示价格脱离下跌期,进入盘整准备上涨阶段,这时策略进行买入操作。当指标从高位跌破卖出线时,则进行卖出操作。
优势分析
- 该策略能够捕捉价格从下跌到盘整再到上涨的转折点,实现低买高卖。
- Chande动量指标考虑了价格变化速度和力度,是一种很好的趋势判断工具。
- 策略操作简单,容易实现。
风险分析
- Chande动量指标对参数敏感,不同周期参数设置会导致交易信号和结果差异很大。
- 买入线和卖出线静态设置也可能导致过多错误信号。
- 策略没有考虑止损,可能导致亏损扩大。
可以设置动态买入线和卖出线,或者结合其他指标过滤信号。同时也应该设置止损来控制风险。
优化方向
- 尝试不同周期的参数来获得最佳效果
- 设置动态的买入卖出线
- 结合其他指标进行信号过滤
- 加入止损逻辑控制风险
总结
单均点横盘突破策略通过Chande动量指标判断价格从下跌到盘整再到上涨的转折点,实现低买高卖。该策略简单实用,能够有效捕捉趋势转折。但参数设置和止损控制等方面还需要进一步优化,以减少错误信号和控制风险。总体来说,该策略为量化交易提供了一种有效判断趋势转折的工具。
策略源码
/*backtest
start: 2024-01-02 00:00:00
end: 2024-02-01 00:00:00
period: 1h
basePeriod: 15m
exchanges: [{"eid":"Futures_Binance","currency":"BTC_USDT"}]
*/

//@version=4

//* Backtesting Period Selector | Component *//
//* https://www.tradingview.com/script/eCC1cvxQ-Backtesting-Period-Selector-Component *//
//* https://www.tradingview.com/u/pbergden/ *//
//* Modifications made *//
testStartYear = input(2021, "Backtest Start Year")
testStartMonth = input(1, "Backtest Start Month")
testStartDay = input(10, "Backtest Start Day")
testPeriodStart = timestamp(testStartYear,testStartMonth,testStartDay,0,0)

testStopYear = input(999999, "Backtest Stop Year")
testStopMonth = input(9, "Backtest Stop Month")
testStopDay = input(26, "Backtest Stop Day")
testPeriodStop = timestamp(testStopYear,testStopMonth,testStopDay,0,0)

testPeriod() => true
/////////////// END - Backtesting Period Selector | Component ///////////////
strategy(title="Chande Momentum Strat", shorttitle="ChandeMO Strat", format=format.price, precision=2)
length = input(9, minval=1)
src = input(close, "Price", type = input.source)
momm = change(src)
f1(m) => m >= 0.0 ? m : 0.0
f2(m) => m >= 0.0 ? 0.0 : -m
m1 = f1(momm)
m2 = f2(momm)
sm1 = sum(m1, length)
sm2 = sum(m2, length)
percent(nom, div) => 100 * nom / div
chandeMO = percent(sm1-sm2, sm1+sm2)
plot(chandeMO, "Chande MO", color=color.blue)
hline(0, color=#C0C0C0, linestyle=hline.style_dashed, title="Zero Line")
buyline= input(-80)
sellline= input(80)
hline(buyline, color=color.gray)
hline(sellline, color=color.gray)

if testPeriod()
    if crossover(chandeMO, buyline)
        strategy.entry("Long", strategy.long, alert_message="a=ABCD b=buy e=binanceus q=1.2 s=uniusd")
    //    strategy.exit(id="Long Stop Loss", stop=strategy.position_avg_price*0.8) //20% stop loss

    if crossunder(chandeMO, sellline)
        strategy.entry("Short", strategy.short, alert_message="a=ABCD b=sell e=binanceus q=1.2 s=uniusd")
    //    strategy.exit(id="Short Stop Loss", stop=strategy.position_avg_price*1.2) //20% stop loss

//      remember to alert as    {{strategy.order.alert_message}}