Dual Moving Average Strategy 360°

Author: ChaoZhang, Date: 2024-02-02 14:29:59
Tags:

img

Overview

The Dual Moving Average Strategy 360° is a quantitative trading strategy that incorporates dual moving averages and trend strength determination. By calculating moving averages over different periods, it determines price trends; meanwhile, by accumulating tangent angles, it judges the strength of trends and achieves more accurate entries and exits.

Strategy Logic

The core logic of the Dual Moving Average Strategy 360° is:

  1. Calculate the 1-minute and Kalman-filtered moving averages;
  2. Calculate the tangent angle based on the price difference between the two moving averages;
  3. Accumulate tangent angles to determine trend strength signals;
  4. Issue trading signals based on whether the accumulated tangent angles exceed preset thresholds.

Specifically, the strategy defines the raw 1-minute moving average and the Kalman-filtered moving average. The Kalman filter eliminates some noise from the moving average to make it smoother. The tangent angle between the two moving averages reflects price trend changes. For example, when the tangent angle is positive, it indicates an upward trend; conversely, a negative angle represents a downward trend.

The strategy chooses 30 minutes as the calculation period to sum all positive and negative tangent angles within that period. When the sum exceeds 360 degrees, it signals an extremely strong trend and issues a long signal; conversely, when the sum is below -360 degrees, it indicates a trend reversal and issues a short signal.

Advantage Analysis

The main advantages of the Dual Moving Average Strategy 360° are:

  1. Moving averages filter out short-term market noise for more reliable trading decisions;
  2. Tangent angles quantify trend strength, avoiding the subjectivity of judging by moving average patterns alone;
  3. Summing multiple tangent angles has better noise reduction effects, resulting in more reliable trading signals;
  4. Compared to single moving average strategies, the dual moving averages combined with trend strength determinations make the strategy more comprehensive and robust.

Risk Analysis

The Dual Moving Average Strategy 360° also carries some risks:

  1. Moving averages lag price changes and may miss short-term trend turning points;
  2. Relying solely on the accumulated trend strength signal can be disrupted by market volatility;
  3. Improper parameter settings (such as calculation period lengths) may lead to missing trades or generating incorrect signals.

To mitigate the above risks, measures like shortening the moving average period, optimizing parameter combinations, adding stop-loss mechanisms can be adopted.

Optimization Directions

The Dual Moving Average Strategy 360° can be further optimized by:

  1. Incorporating adaptive moving averages that adjust parameters based on market volatility;
  2. Referencing multiple moving average periods to form optimized parameter combinations;
  3. Adding dynamic trend determination modules based on volatility, trading volumes, etc.;
  4. Assisting parameter tuning or trade decisions with machine learning models.

Summary

The Dual Moving Average Strategy 360° utilizes moving average filtering and quantitative tangent angle trend judgments to achieve a relatively robust quantitative trading strategy. Compared to single technical indicators, this strategy forms a more comprehensive consideration and has stronger practicality. But parameter tuning and risk control are still vital, and the strategy can be further optimized for even better results going forward.


/*backtest
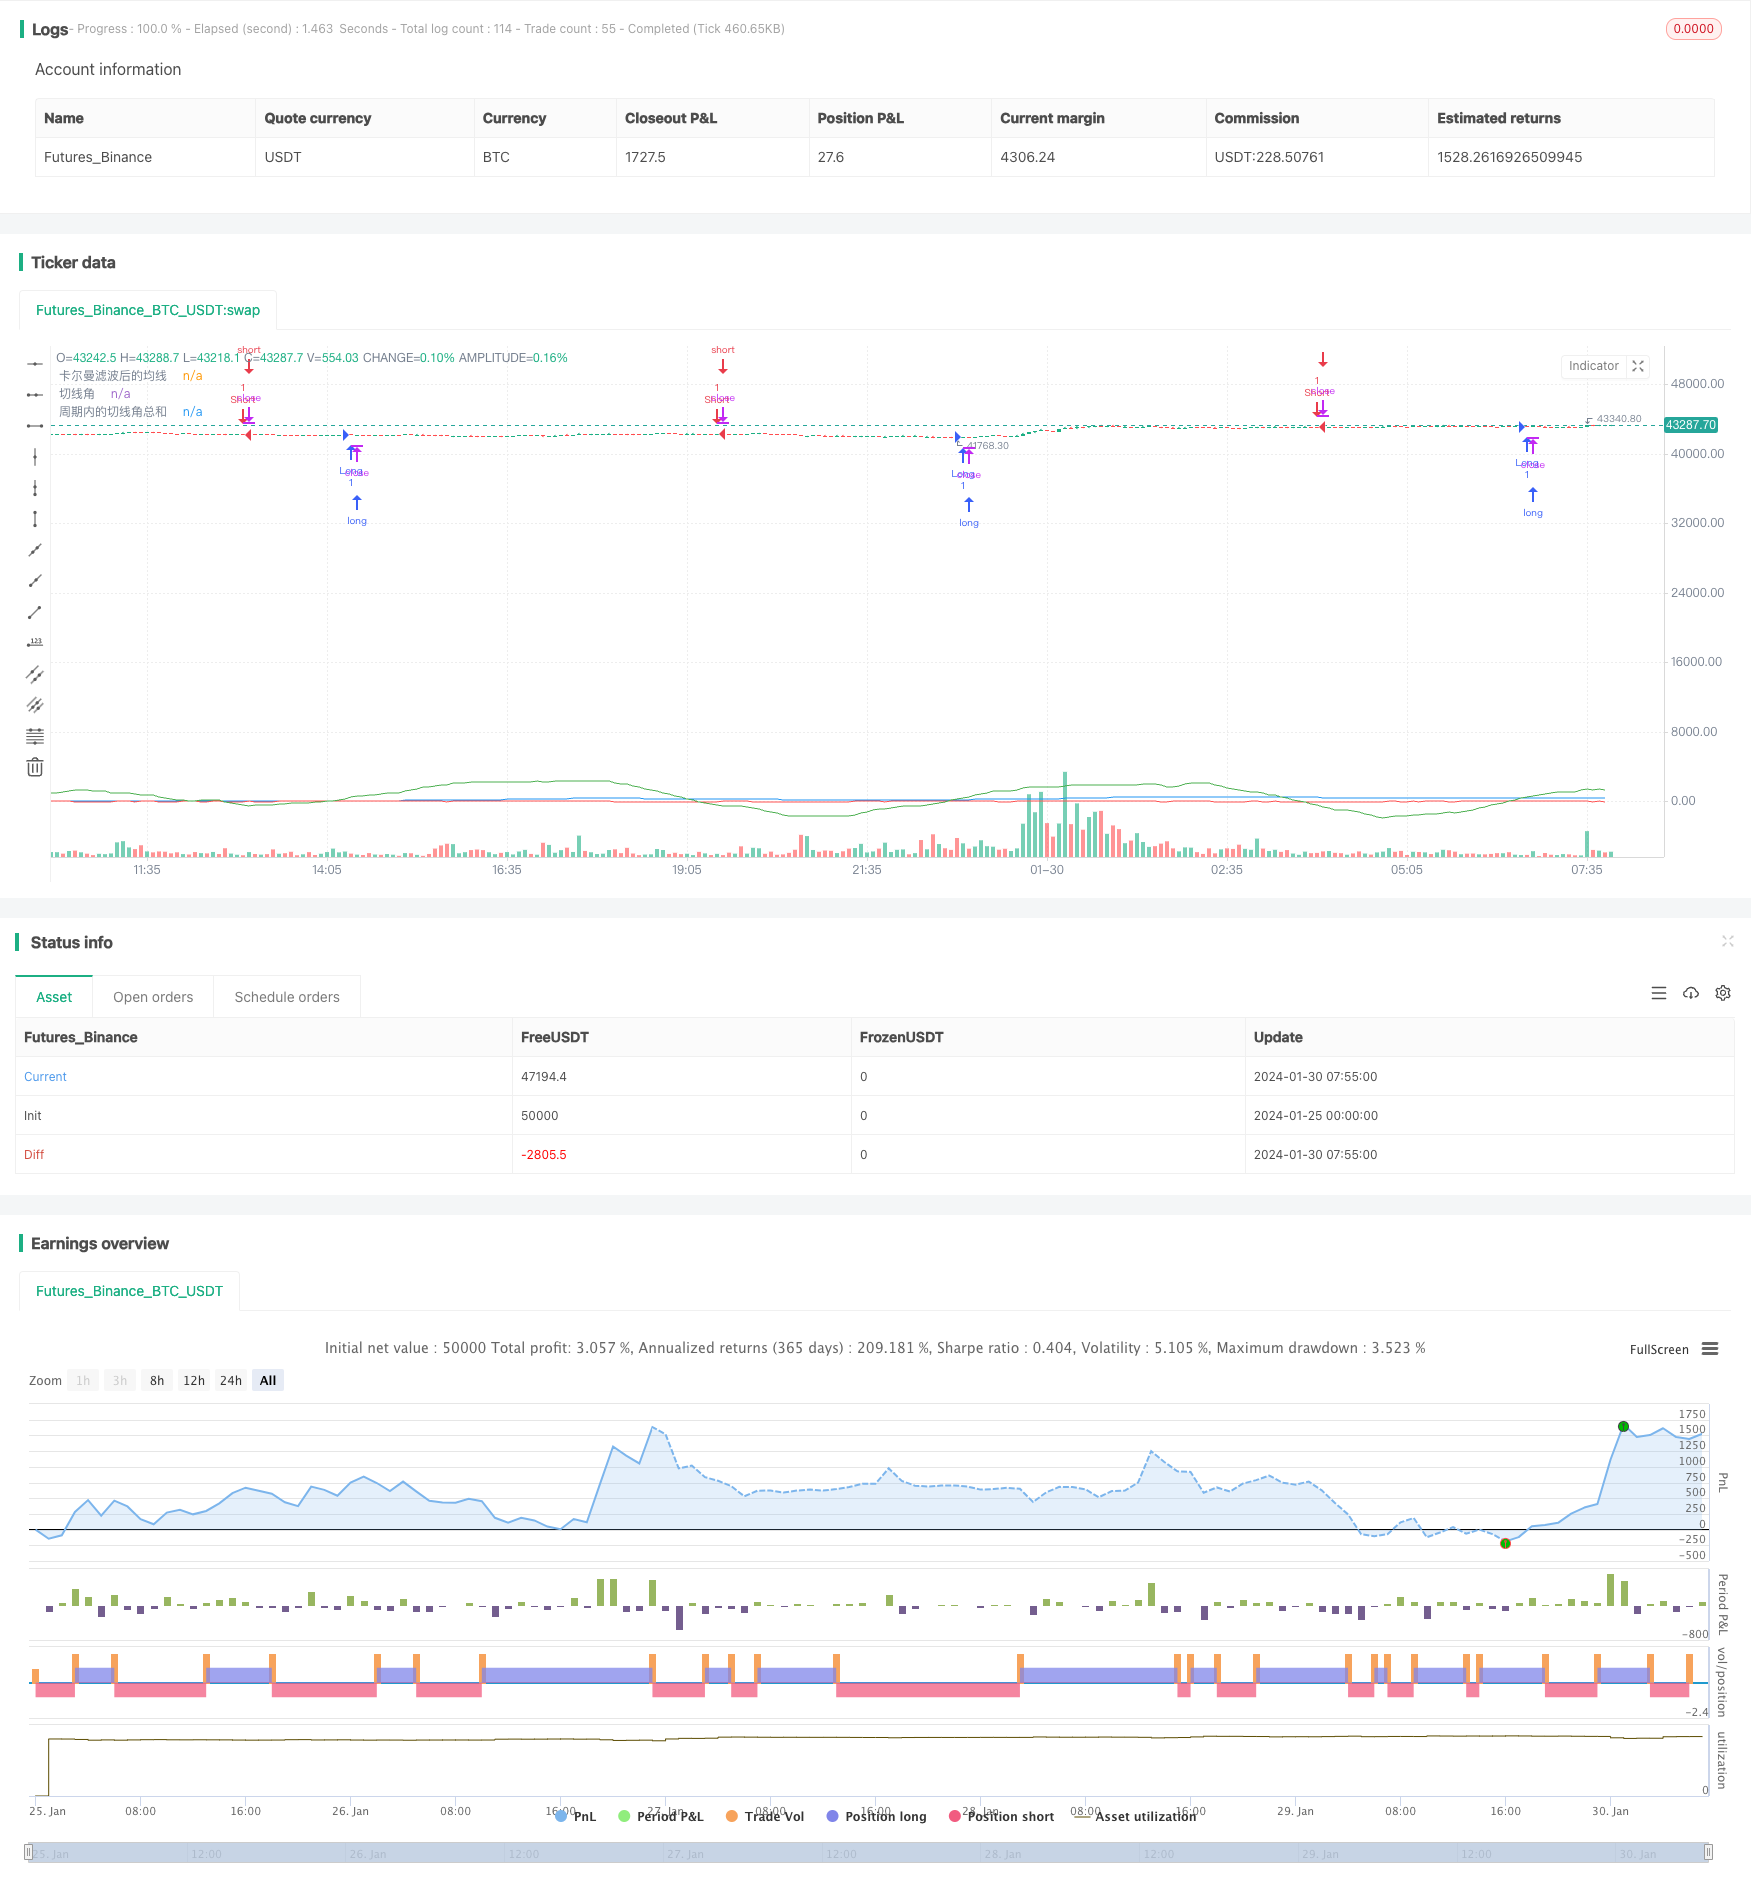
start: 2024-01-25 00:00:00
end: 2024-01-30 08:00:00
period: 5m
basePeriod: 1m
exchanges: [{"eid":"Futures_Binance","currency":"BTC_USDT"}]
*/

//@version=5
//@library=math
strategy("策略360°(测试)", overlay=true)

// 定义1分钟均线
ma1 = request.security(syminfo.tickerid, "1", ta.sma(close, 1)) // 在这里使用了 math.sma() 函数
//plot(ma1, color=color.yellow, title="原始均线")

// 定义卡尔曼滤波函数,参考了[1](https://www.tradingview.com/pine-script-docs/en/v5/language/Methods.html)和[2](https://www.tradingview.com/pine-script-docs/en/v5/language/Operators.html)的代码
kalman(x, g) => 
    kf = 0.0 
    dk = x - nz(kf[1], x) // 在这里使用了 nz() 函数
    smooth = nz(kf[1], x) + dk * math.sqrt(g * 2) // 在这里使用了 math.sqrt() 函数
    velo = 0.0 
    velo := nz(velo[1], 0) + g * dk // 在这里使用了 nz() 函数
    kf := smooth + velo 
    kf 

// 定义卡尔曼滤波后的均线
ma2 = kalman(ma1, 0.01) 
plot(ma2, color=color.blue, title="卡尔曼滤波后的均线")

// 定义切线角
angle = math.todegrees(math.atan(ma2 - ma2[1])) // 在这里使用了 math.degrees() 和 math.atan() 函数

// 定义累加的切线角
cum_angle = 0.0
cum_angle := nz(cum_angle[1], 0) + angle // 在这里使用了 nz() 函数

// 定义30分钟周期
period = 30 // 您可以根据您的需要修改这个参数

// 定义周期内的切线角总和
sum_angle = 0.0
sum_angle := math.sum(angle, period) // 在这里使用了 math.sum() 函数,把周期内的切线角总和改成简单地把 5 个切线角相加

// 定义买入和卖出条件
buy = sum_angle > 360// 在这里使用了 math.radians() 函数
sell = sum_angle < -360

// 执行买入和卖出操作
strategy.entry("Long", strategy.long, when=buy)
strategy.close("Short", when=buy)
strategy.entry("Short", strategy.short, when=sell)
strategy.close("Long", when=sell)

// 绘制曲线图
plot(sum_angle, color=color.green, title="周期内的切线角总和")
plot(angle, color=color.red, title="切线角") // 这是我为您添加的代码,用于显示实时计算的切线角


More