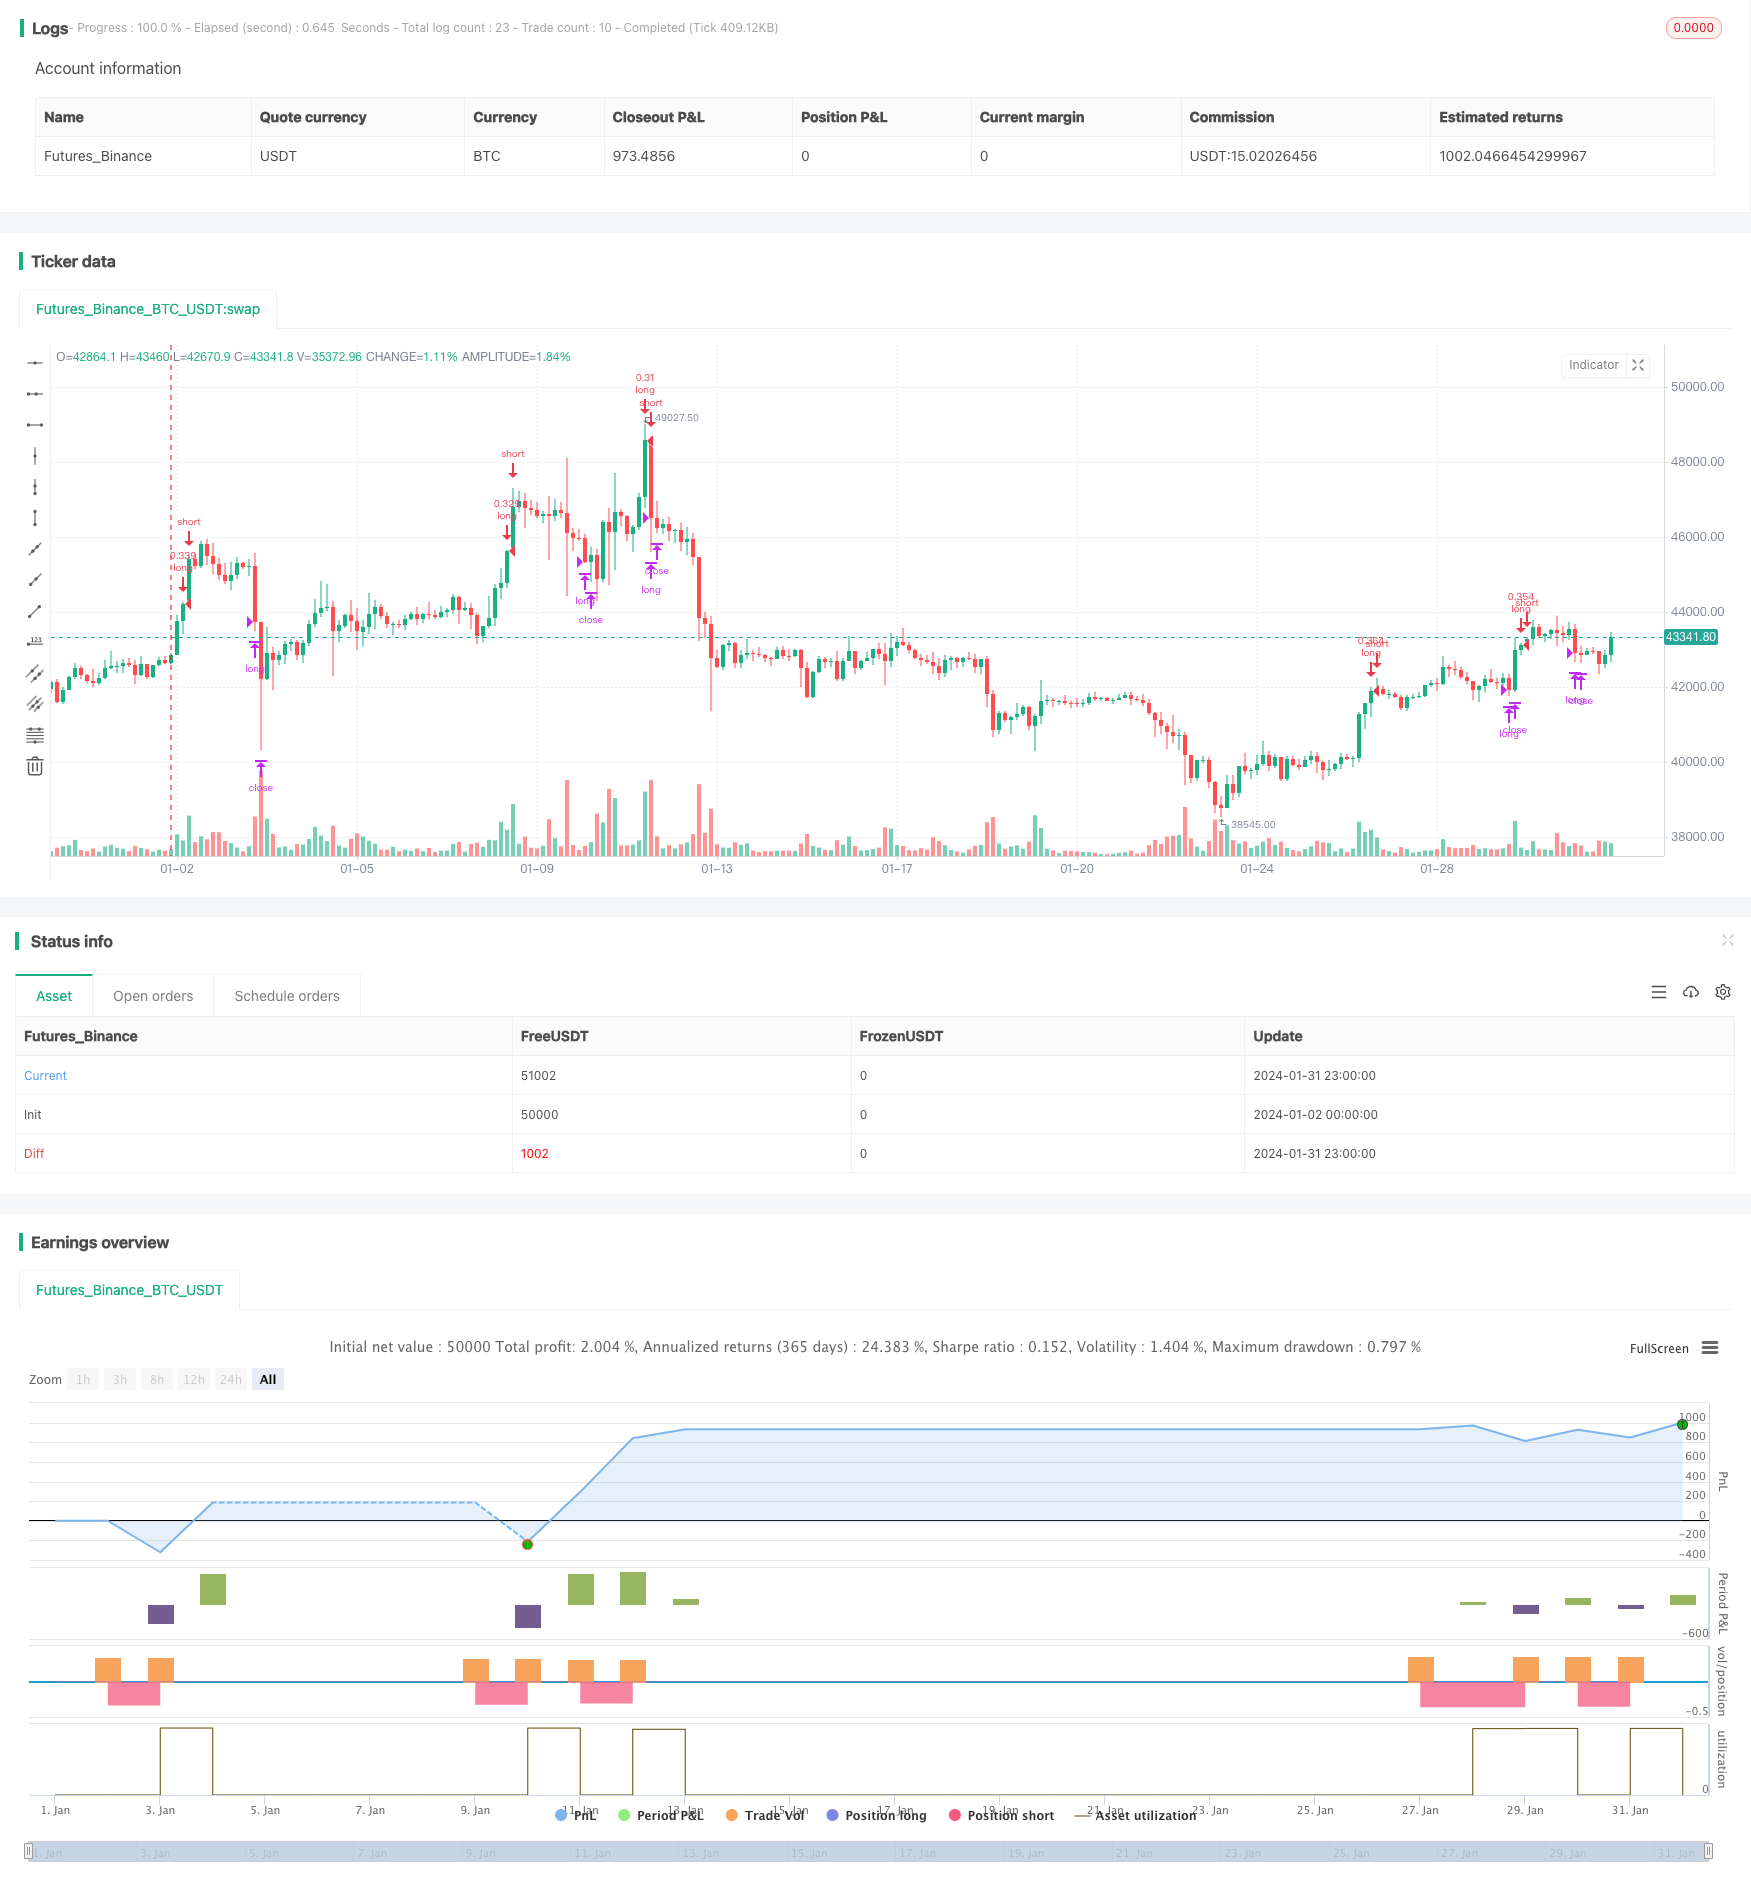
概述
根据技术分析,RSI指标高于70应代表超买状态,因此属于卖出信号。加密货币代表了一个全新的资产类别,它重塑了技术分析的概念。FOMO型购买可以产生很强的力量,使得数字资产可以在超买状态下保持足够长的时间,为追踪上涨趋势提供了良好的短线交易机会。
构建一个基于通常被认为是反向指标的RSI的追踪趋势交易策略,这看起来似乎违反直觉。但是通过200多次回测证明,这是一个非常有趣的长期策略设置。
策略原理
该策略假设每笔订单交易可用资金的30%。考虑了0.1%的交易费用,该费用与币安(全球最大的加密货币交易所)的基础费用相符。
- 进入信号:当RSI大于70且在回测窗口内时做多
- 退出信号:当RSI小于55或者收盘价大于止盈价时平仓
优势分析
- 利用RSI指标识别趋势,避免在震荡行情中错过信号
- 定额仓位管理,有效控制单笔损失
- 适合中长线持有,避免被短期波动击出
风险分析
- 需确保RSI参数设定合理,否则可能在超买超卖中产生错误信号
- 追踪止盈需要及时更新,否则可能错过利润
- 需关注市场异常波动带来的风险,必要时调整仓位或停损
优化方向
- 可以考虑结合其他指标如MACD等判断趋势
- 可以测试不同的RSI参数设置
- 可以引入动态止盈,根据市场波动自动调整止盈价
总结
本策略利用RSI指标识别超买状态判断趋势方向,在追踪上涨趋势中逐步止盈。相比传统看跌的RSI运用方式,本策略提供了新的思路。通过严格的回测验证,该策略获得了良好的表现。但我们也需要关注一些潜在风险,并做好参数调整与优化。总体来说,本策略为量化交易提供了一个简单实用的趋势跟踪方案。
策略源码
/*backtest
start: 2024-01-02 00:00:00
end: 2024-02-01 00:00:00
period: 3h
basePeriod: 15m
exchanges: [{"eid":"Futures_Binance","currency":"BTC_USDT"}]
*/

//@version=1
strategy(shorttitle='Trend-following RSI Scalping Strategy (by Coinrule)',title='Trend-following RSI Strategy ', overlay=true, initial_capital = 1000, default_qty_type = strategy.percent_of_equity, default_qty_type = strategy.percent_of_equity, default_qty_value = 30, commission_type=strategy.commission.percent, commission_value=0.1)

//Backtest dates
fromMonth = input(defval = 1,  title = "From Month")
fromDay   = input(defval = 10,    title = "From Day")
fromYear  = input(defval = 2020, title = "From Year")
thruMonth = input(defval = 1,    title = "Thru Month")
thruDay   = input(defval = 1,    title = "Thru Day")
thruYear  = input(defval = 2112, title = "Thru Year")

showDate  = input(defval = true, title = "Show Date Range")

start     = timestamp(fromYear, fromMonth, fromDay, 00, 00)        // backtest start window
finish    = timestamp(thruYear, thruMonth, thruDay, 23, 59)        // backtest finish window
window()  => true


// RSI inputs and calculations
lengthRSI = input(14, title = 'RSI period', minval=1)
RSI = rsi(close, lengthRSI)

//Entry


strategy.entry(id="long", long = true, when = RSI > 70 and window())

//Exit

Take_profit= ((input (6))/100)
longTakeProfit = strategy.position_avg_price * (1 + Take_profit)

strategy.close("long", when = RSI < 55 or close > longTakeProfit and window())