概述
本策略是一个只做多头的Ichimoku云交易策略。它在转换线上穿基准线时开仓做多,在基准线下穿转换线时平仓。此外,在开仓和平仓时还会检测滞后Span,如果滞后Span高于云层就开仓,低于云层就平仓。
策略原理
该策略使用Ichimoku技术指标中的几条线。具体来说:
转换线:最近9天的最高价和最低价的平均值,代表一定期间的趋势转换。
基准线:最近26天的最高价和最低价的平均值,代表一定期间内的平均价格变动。
前沿线A:转换线和基准线的平均值。
前沿线B:最近52天的最高价和最低价的平均值,代表中长期趋势的先导指标。
滞后Span:当前收盘价,滞后推移26天。代表趋势的力量。
在开仓时,要同时满足转换线上穿基准线和滞后Span高于云层的条件。这表示短期和中长期趋势都是向上的信号。
平仓时,要同时满足基准线下穿转换线和滞后Span低于云层的条件。这表示趋势发生逆转,应该退出头寸。
策略优势
使用Ichimoku云指标判断趋势,准确性较高。
同时结合多条线判断,避免produce假信号。
只做多头,符合大部分数字货币的长线上涨趋势。
条件过滤相对严格,实现质量较高的信号。
策略风险
仓位只有全仓或空仓,无法调整仓位规模。
在牛市中表现出色,但在熊市中亏损风险大。
参数默认设置针对加密货币,需要调整以适应其他品种。
交易信号较少,容易错过部分机会。
策略优化
增加仓位调整功能,在亏损达到一定比例时关闭部分仓位。
添加卖出信号,在关键支持下方平仓,减少亏损。
优化参数设置,使其能够适应更多品种,提高稳定性。
增加止损功能,在亏损达到阈值时止损。
总结
本策略作为一个只做多头的Ichimoku云交易策略,在判断趋势中具有较高的准确性。它同时结合了多条Ichimoku线作为过滤条件,可以较为可靠地判断趋势转折点。该策略特别适合那些长线上涨的品种,比如加密货币。通过进一步完善止损、调仓等功能,可以使该策略的风险控制能力得到提升,适应更多品种和更广泛的市场环境。
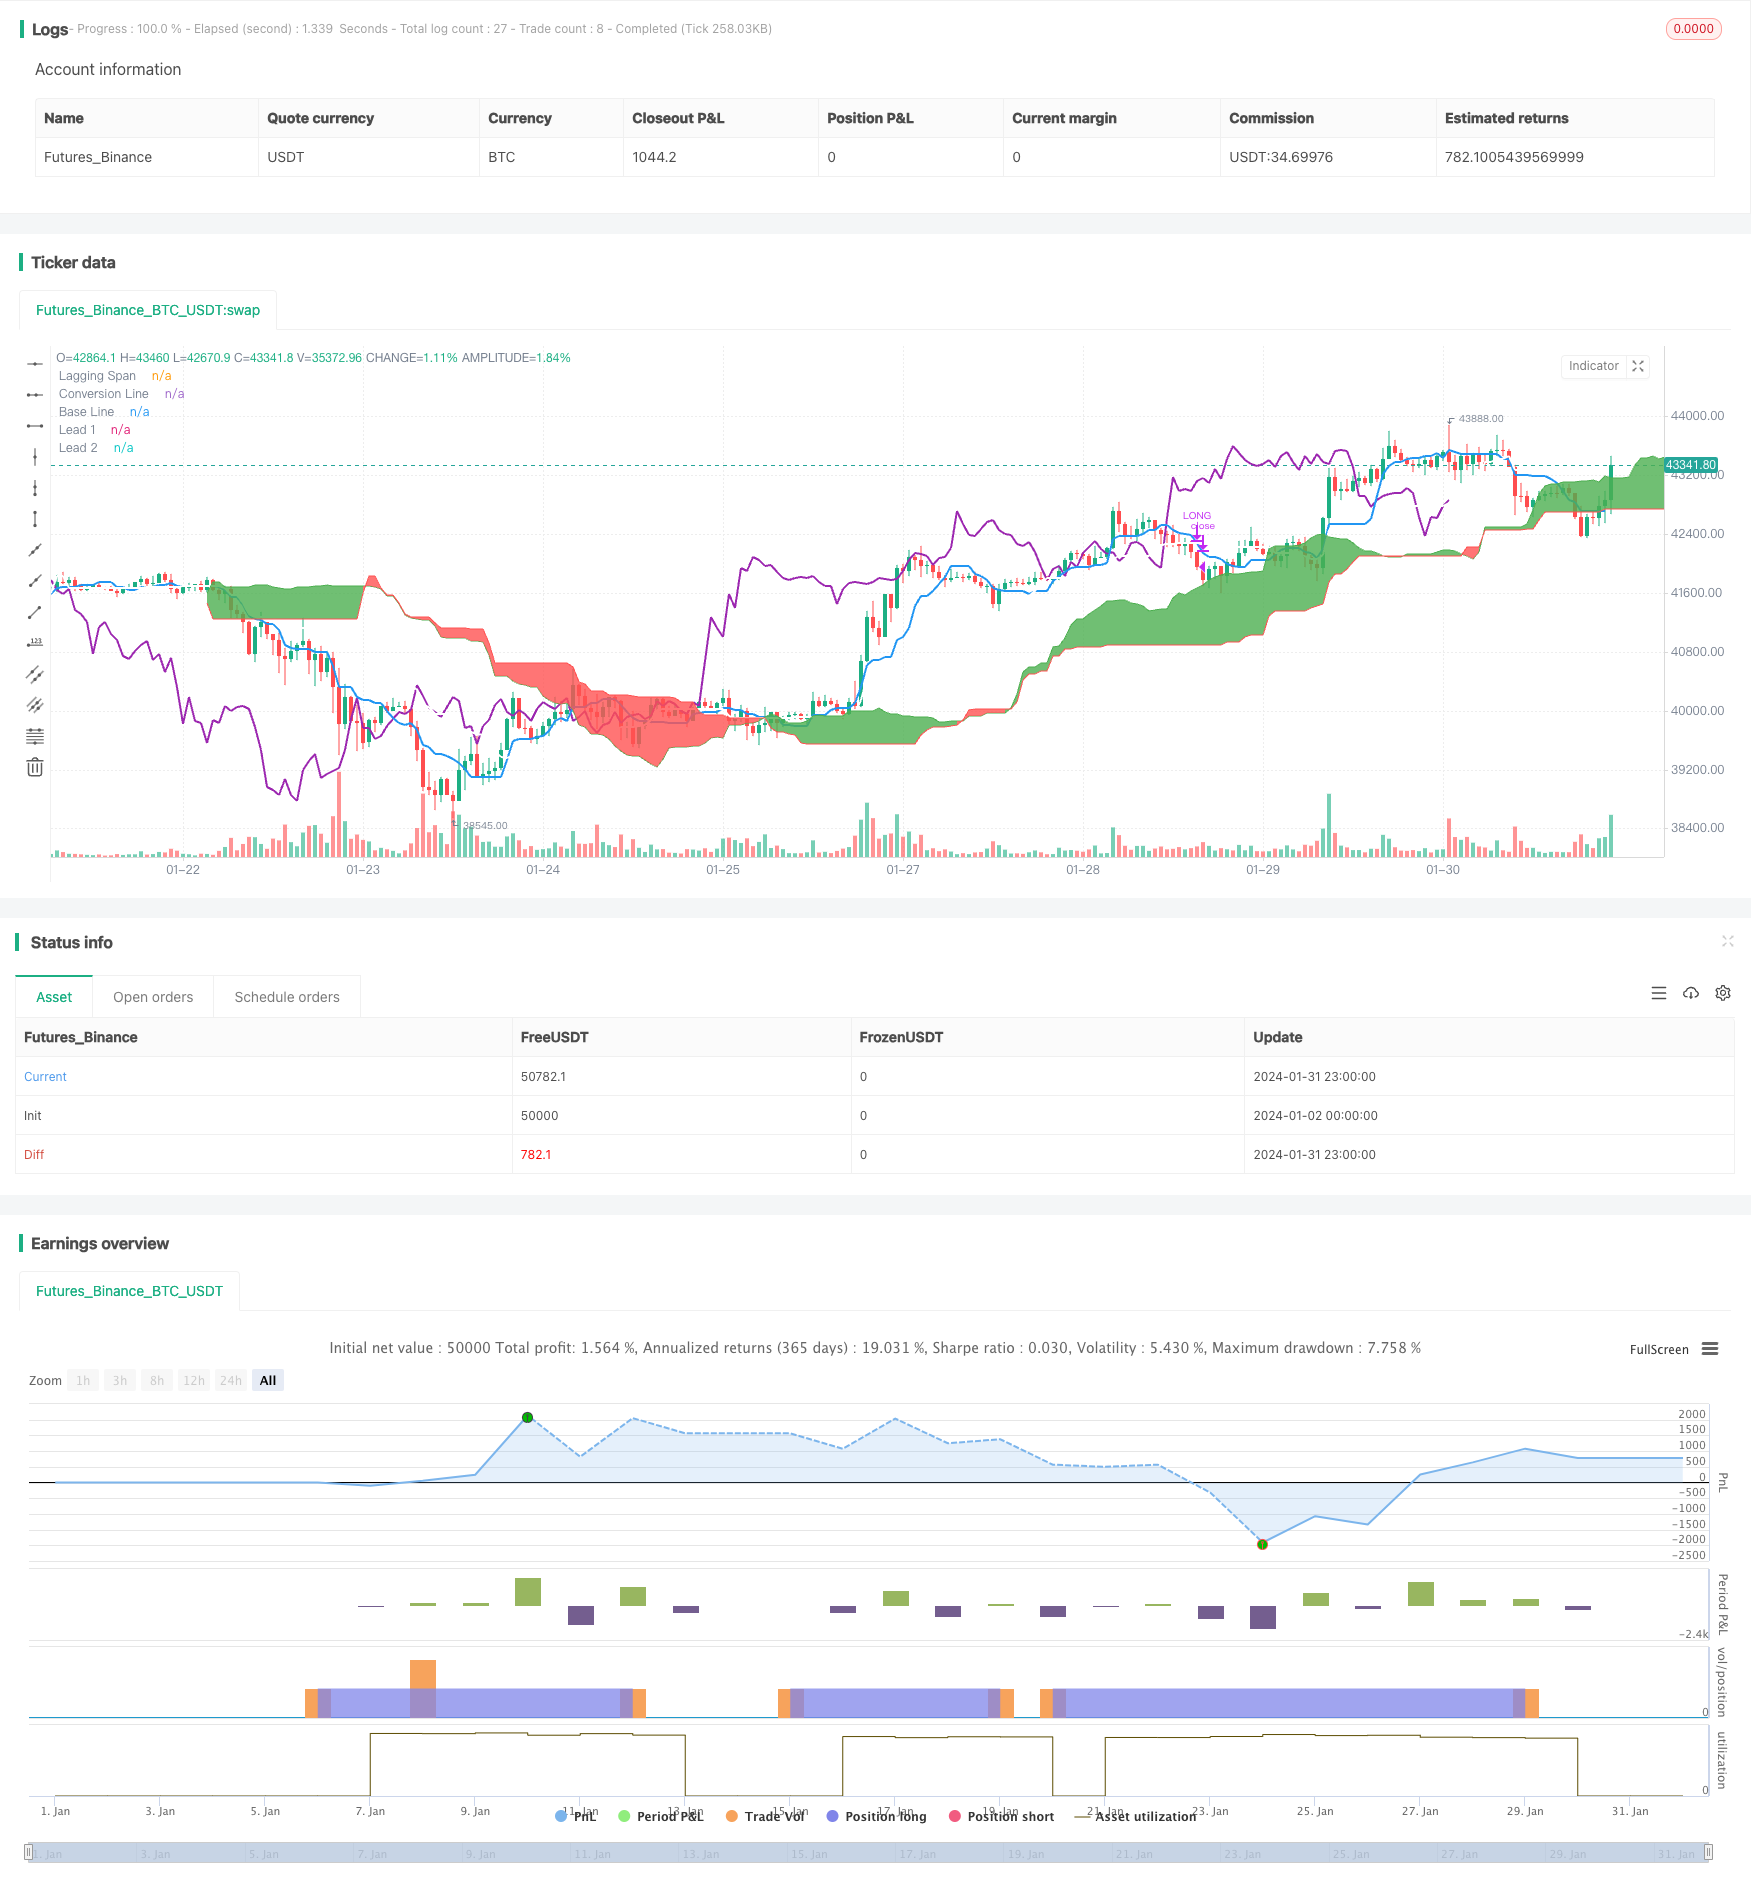
/*backtest
start: 2024-01-02 00:00:00
end: 2024-02-01 00:00:00
period: 1h
basePeriod: 15m
exchanges: [{"eid":"Futures_Binance","currency":"BTC_USDT"}]
*/

// This source code is subject to the terms of the Mozilla Public License 2.0 at https://mozilla.org/MPL/2.0/
// Simple long-only Ichimoku Cloud Strategy
// Enter position when conversion line crosses base line up, and close it when the opposite happens.
// Additional condition for open / close the trade is lagging span, it should be higher than cloud to open position and below - to close it.
//@version=4
strategy("Ichimoku Cloud Strategy Long Only", shorttitle="Ichimoku Cloud Strategy (long only)", overlay=true )

conversion_length = input(9, minval=1, title="Conversion Line Periods"),
base_length = input(26, minval=1, title="Base Line Periods")
lagging_length = input(52, minval=1, title="Lagging Span 2 Periods"),
delta = input(26, minval=1, title="Delta")

average(len) => avg(lowest(len), highest(len))

conversion_line = average(conversion_length) // tenkan sen - trend
base_line = average(base_length) // kijun sen - movement
lead_line_a = avg(conversion_line, base_line) // senkou span A
lead_line_b = average(lagging_length) // senkou span B
lagging_span = close // chikou span - trend / move power

plot(conversion_line, color=color.blue, linewidth=2, title="Conversion Line")
plot(base_line, color=color.white, linewidth=2, title="Base Line")
plot(lagging_span, offset = -delta, color=color.purple, linewidth=2, title="Lagging Span")

lead_line_a_plot = plot(lead_line_a, offset = delta, color=color.green, title="Lead 1")
lead_line_b_plot = plot(lead_line_b, offset = delta, color=color.red, title="Lead 2")
fill(lead_line_a_plot, lead_line_b_plot, color = lead_line_a > lead_line_b ? color.green : color.red)

// Strategy logic

long_signal = crossover(conversion_line,base_line) and ((lagging_span) > (lead_line_a)) and ((lagging_span) > (lead_line_b))
short_signal = crossover(base_line, conversion_line) and ((lagging_span) < (lead_line_a)) and ((lagging_span) < (lead_line_b))

strategy.entry("LONG", strategy.long, when=strategy.opentrades == 0 and long_signal, alert_message='BUY')
strategy.close("LONG", when=strategy.opentrades > 0 and short_signal, alert_message='SELL')

    // === Backtesting Dates === thanks to Trost

testPeriodSwitch = input(true, "Custom Backtesting Dates")
testStartYear = input(2021, "Backtest Start Year")
testStartMonth = input(1, "Backtest Start Month")
testStartDay = input(1, "Backtest Start Day")
testStartHour = input(0, "Backtest Start Hour")
testPeriodStart = timestamp(testStartYear, testStartMonth, testStartDay, testStartHour, 0)
testStopYear = input(2021, "Backtest Stop Year")
testStopMonth = input(12, "Backtest Stop Month")
testStopDay = input(1, "Backtest Stop Day")
testStopHour = input(0, "Backtest Stop Hour")
testPeriodStop = timestamp(testStopYear, testStopMonth, testStopDay, testStopHour, 0)
testPeriod() => true
testPeriod_1 = testPeriod()
isPeriod = testPeriodSwitch == true ? testPeriod_1 : true
// === /END

if not isPeriod
    strategy.cancel_all()
    strategy.close_all()