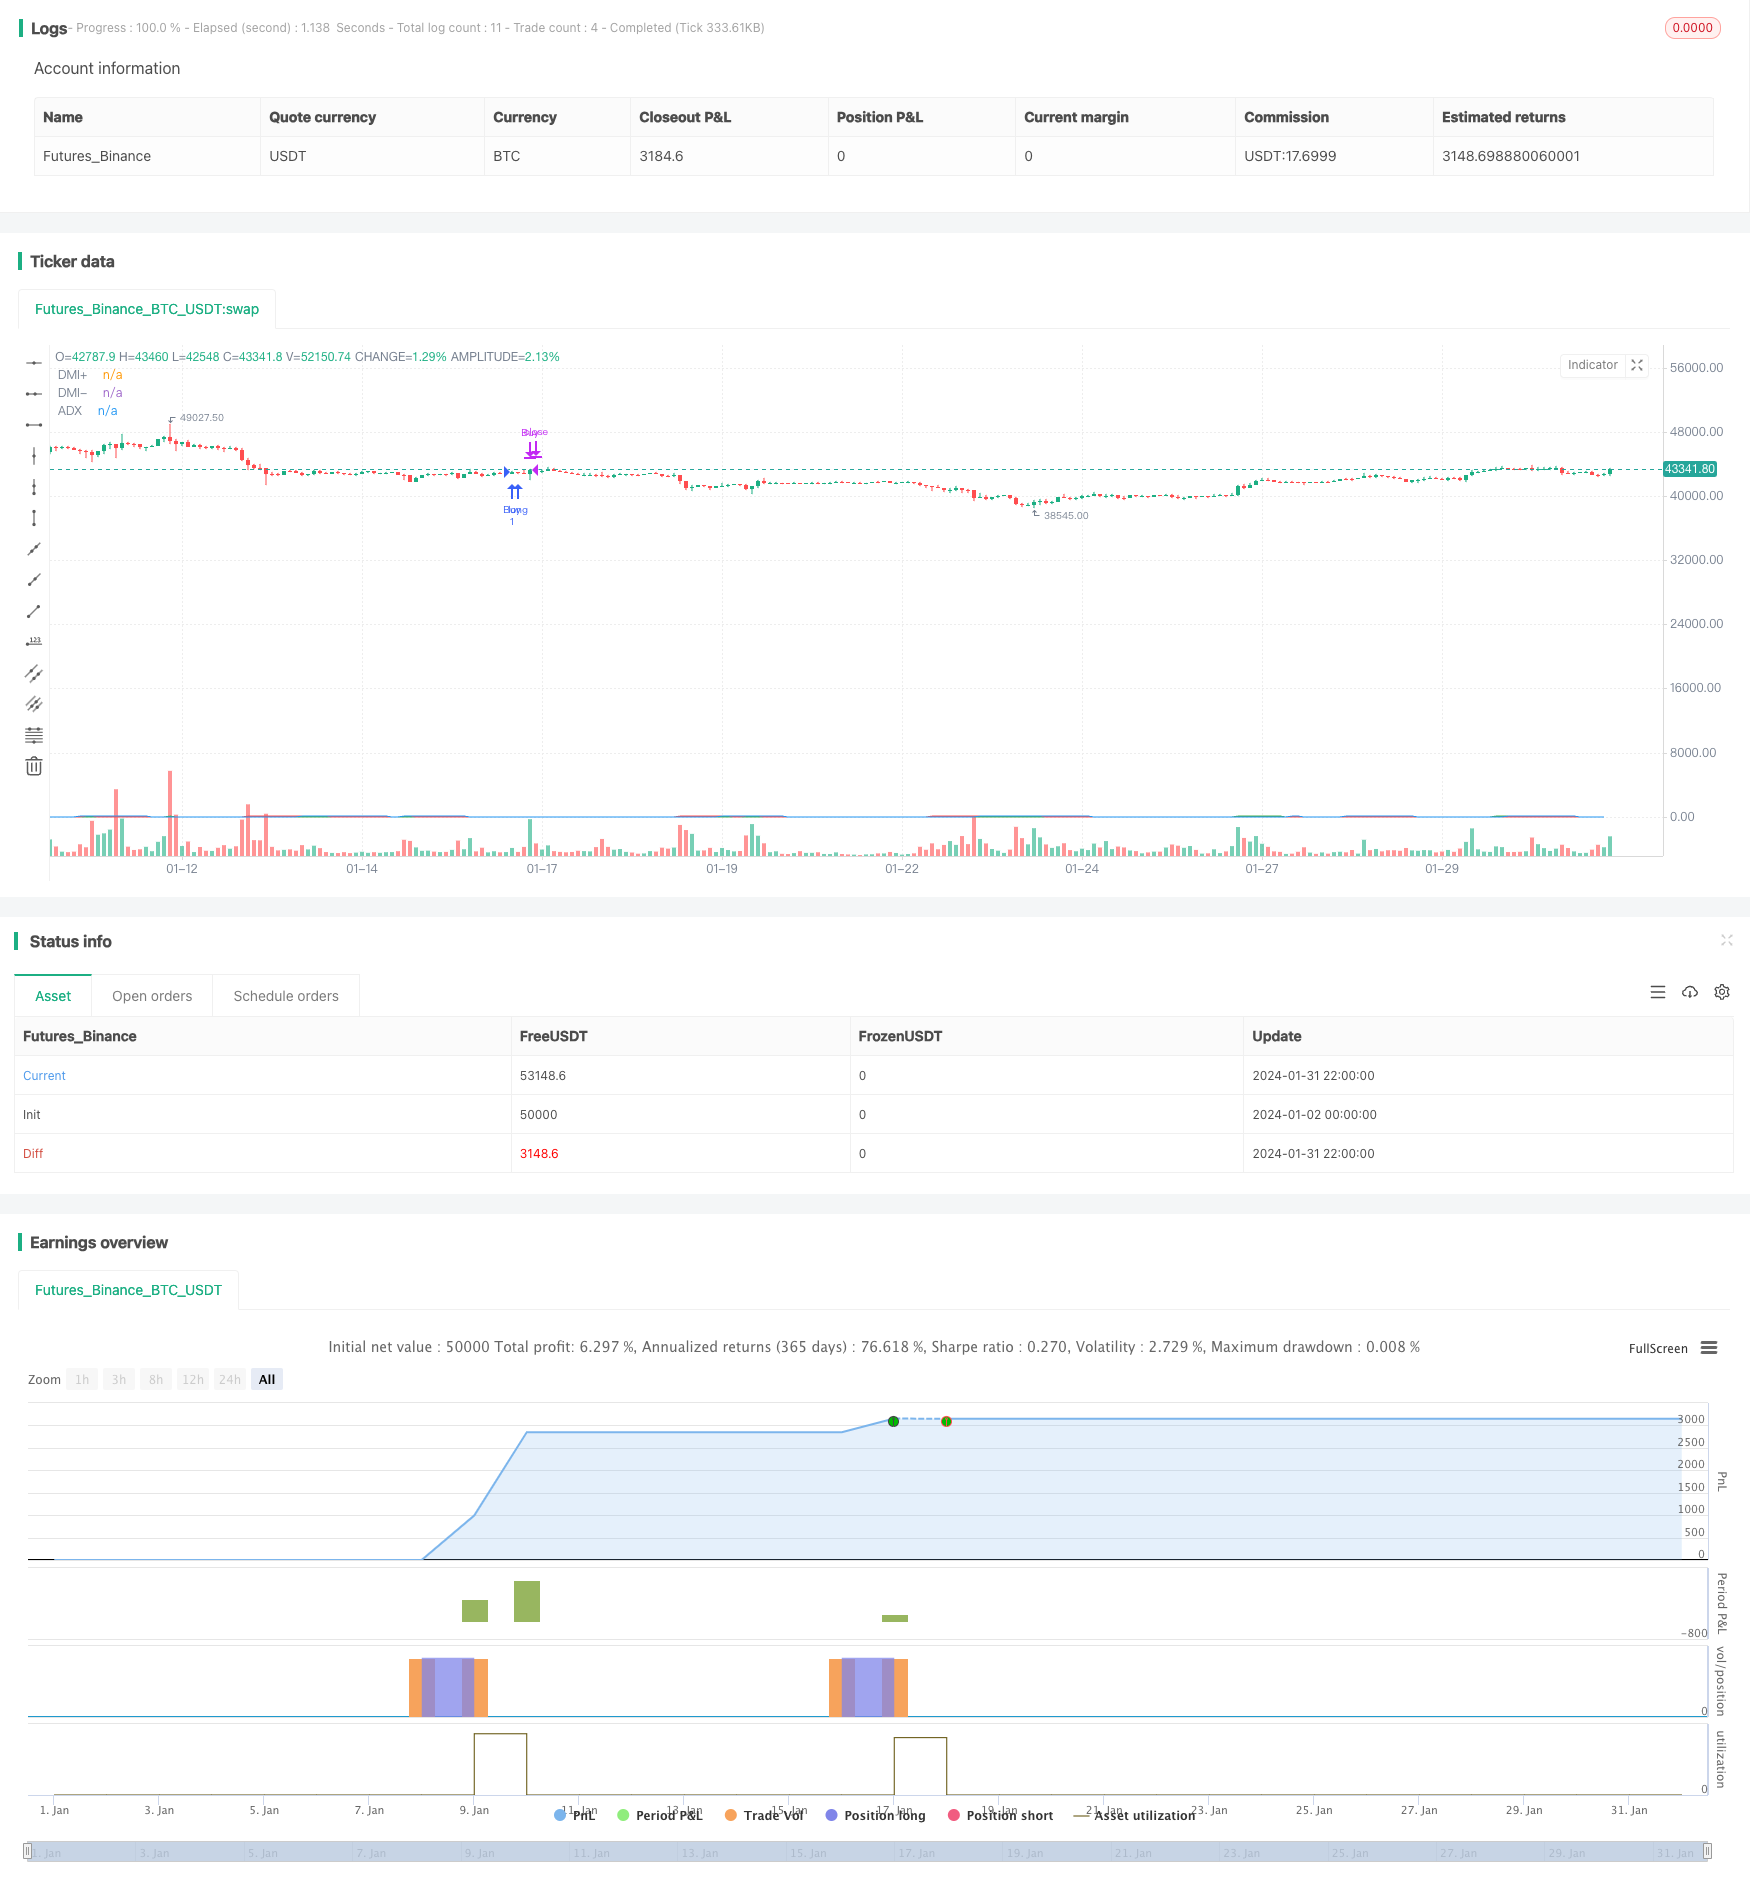
This strategy generates buy and sell signals based on the Direction Movement Index (DMI) indicators for trend direction. It utilizes the crossover of DMI’s two indicators, DMI+ and DMI-, as well as their crossover with ADX to determine the bullish/bearish state and trend of the market, thereby producing entry and exit signals.
The strategy mainly uses three indicators from DMI: DMI+, DMI- and ADX. DMI+ reflects the strength of an uptrend, DMI- reflects the strength of a downtrend, while ADX reflects the trend intensity.
The buy signal is triggered when DMI+ crosses over DMI- and also crosses over ADX, indicating a switch from a bearish to bullish state and an emerging trend.
The sell signal is triggered when DMI+ crosses below either DMI- or ADX, indicating weakening bullish momentum and a need to take profit.
Therefore, the strategy dynamically adjusts positions by judging market sentiment and trend changes using the crossover patterns of the DMI indicators.
The main advantages of this strategy are:
Using DMI for trend and sentiment analysis provides reliability in capturing major trends.
Incorporating ADX to gauge trend strength allows more accurate identification of inflection points.
The simple, clear crossover signals of DMI indicators make this strategy easy to implement.
Running with the trend provides good risk control, suitable for medium- to long-term holding periods.
Several risks to note:
DMI indicators have some lag, which may result in late buys and premature sells.
ADX has mediocre performance in distinguishing between trends and consolidations, thus some short-term opportunities may be missed.
There is some risk of holding no positions, in case persistent uptrend or downtrend occurs.
Parameter optimization risks exist, which may lead to deteriorated performance in live trading.
Some ways to improve this strategy:
Incorporate other indicators to spot momentum divergence, enhancing accuracy of entries and exits.
Add stop-loss mechanisms to limit loss in adverse moves.
Adjust parameters or introduce adaptive settings to mitigate optimization bias.
Implement position sizing to dynamically adjust stakes according to trend stages.
This DMI trend-following strategy is simple and practical for catching major trends over medium- to long-term horizons. However, lags, empty positions, and parameter optimization risks exist. Enhancements through combining indicators, stop losses, adaptive parameters etc. can improve live performance.
//@version=5 strategy("DMI Buy/Sell Strategy", overlay=true) // Input for DMI length = input(14, title="DMI Length") adxsmoothing =14 // Calculate DMI [diPlus, diMinus, adx] = ta.dmi(length,adxsmoothing) // Condition for Buy Entry buyCondition = ta.crossover(diPlus, diMinus) and ta.crossover(diPlus, adx) // Condition for Sell Exit sellCondition = ta.crossunder(diPlus,diMinus) or ta.crossunder(diPlus,adx) // Execute Buy Entry on the next day's open if buyCondition strategy.entry("Buy", strategy.long) // Execute Sell Exit on the next day's open if sellCondition strategy.close("Buy") // Plotting DMI components plot(diPlus, title="DMI+", color=color.green) plot(diMinus, title="DMI-", color=color.red) // Plotting ADX plot(adx, title="ADX", color=color.blue)template: strategy.tpl:40:21: executing "strategy.tpl" at <.api.GetStrategyListByName>: wrong number of args for GetStrategyListByName: want 7 got 6