概述
双EMA均线追踪策略(Dual Exponential Moving Average Trend Following Strategy)是一种基于均线交叉的趋势跟踪策略。该策略通过计算快线EMA和慢线EMA,并根据它们的交叉情况来判断当前趋势方向。当快线上穿慢线时,判断为看涨;当快线下穿慢线时,判断为看跌。根据判断出的趋势方向,该策略可以进行看涨或看跌操作。
策略原理
该策略的核心逻辑在于计算两条不同周期的EMA均线,一条作为空头线,一条作为多头线。具体来说,策略通过talib指标计算出一条8周期的快速EMA均线,作为多头线;另外计算出一条21周期的慢速EMA均线,作为空头线。然后判断快速EMA线和慢速EMA线的交叉关系,当快线上穿慢线时,判断为看涨,可以做多;当快线下穿慢线时,判断为看跌,可以做空。
在具体实施交易操作时,该策略既可以只做多,也可以只做空;还可以在快慢线发生交叉时,同时进行双向交易。此外,策略还设置有止损和止盈价格。在开仓后,如果价格运行方向不利,将止损退出;如果价格运行达到预期目标,将止盈收场。
优势分析
双EMA均线追踪策略的最大优势在于使用了均线交叉的强大趋势判断能力。EMA均线作为一种常用的趋势判断工具,通过均线交叉来识别价格变化趋势和转折时机,可以避免被短线市场噪音所迷惑,把握主要的趋势方向。
另外,策略灵活的交易方向设置,既可以适应单向行情,也能捕捉价格在震荡区间的双向机会,增加了策略的实用性。同时设置止损止盈,可以有效控制风险,locking住部分利润。
风险分析
双EMA均线追踪策略最大的风险在于,震荡行情下的多次小幅度交叉造成交叉信号的频繁触发和虚假信号。这将导致策略频繁开仓和损失。这种情况下,可以适当增大EMA周期,减少交叉次数和虚假信号发生概率。
另一方面,止损范围设置过小也会增加策略被击出的概率。这种情况下,可以适当扩大止损范围,但也需要权衡被套利盘的风险。
优化方向
该策略可以从以下几个方面进一步优化:
动态调整EMA均线周期。可以根据市场波动率和最优参数回测结果,让EMA周期动态变化,避免固定周期下的过拟合问题。
增加过滤条件过滤虚假信号。例如可以结合交易量,过滤小幅震荡时产生的假交叉。也可以结合其他指标,如MACD、KDJ等,避免在不确定的时段产生信号。
优化止损止盈策略,结合ATR等指标,可以实现止损止盈的动态跟踪。避免止损过小和止盈过早的问题。
测试不同的持仓时间。持仓时间过长,容易被突发事件影响;持仓时间过短,则交易成本和滑点成本较高。找到最佳持仓天数,可以提高策略盈利能力。
总结
双EMA均线追踪策略整体来说是一个稳健实用的趋势跟踪策略。它利用EMA均线交叉判断价格趋势,可以有效把握行情方向。同时 Settings灵活的交易方向设置提高了策略适应性;以及止损止盈设置控制了风险。通过进一步优化和完善,该策略可以成为量化交易的有力工具。
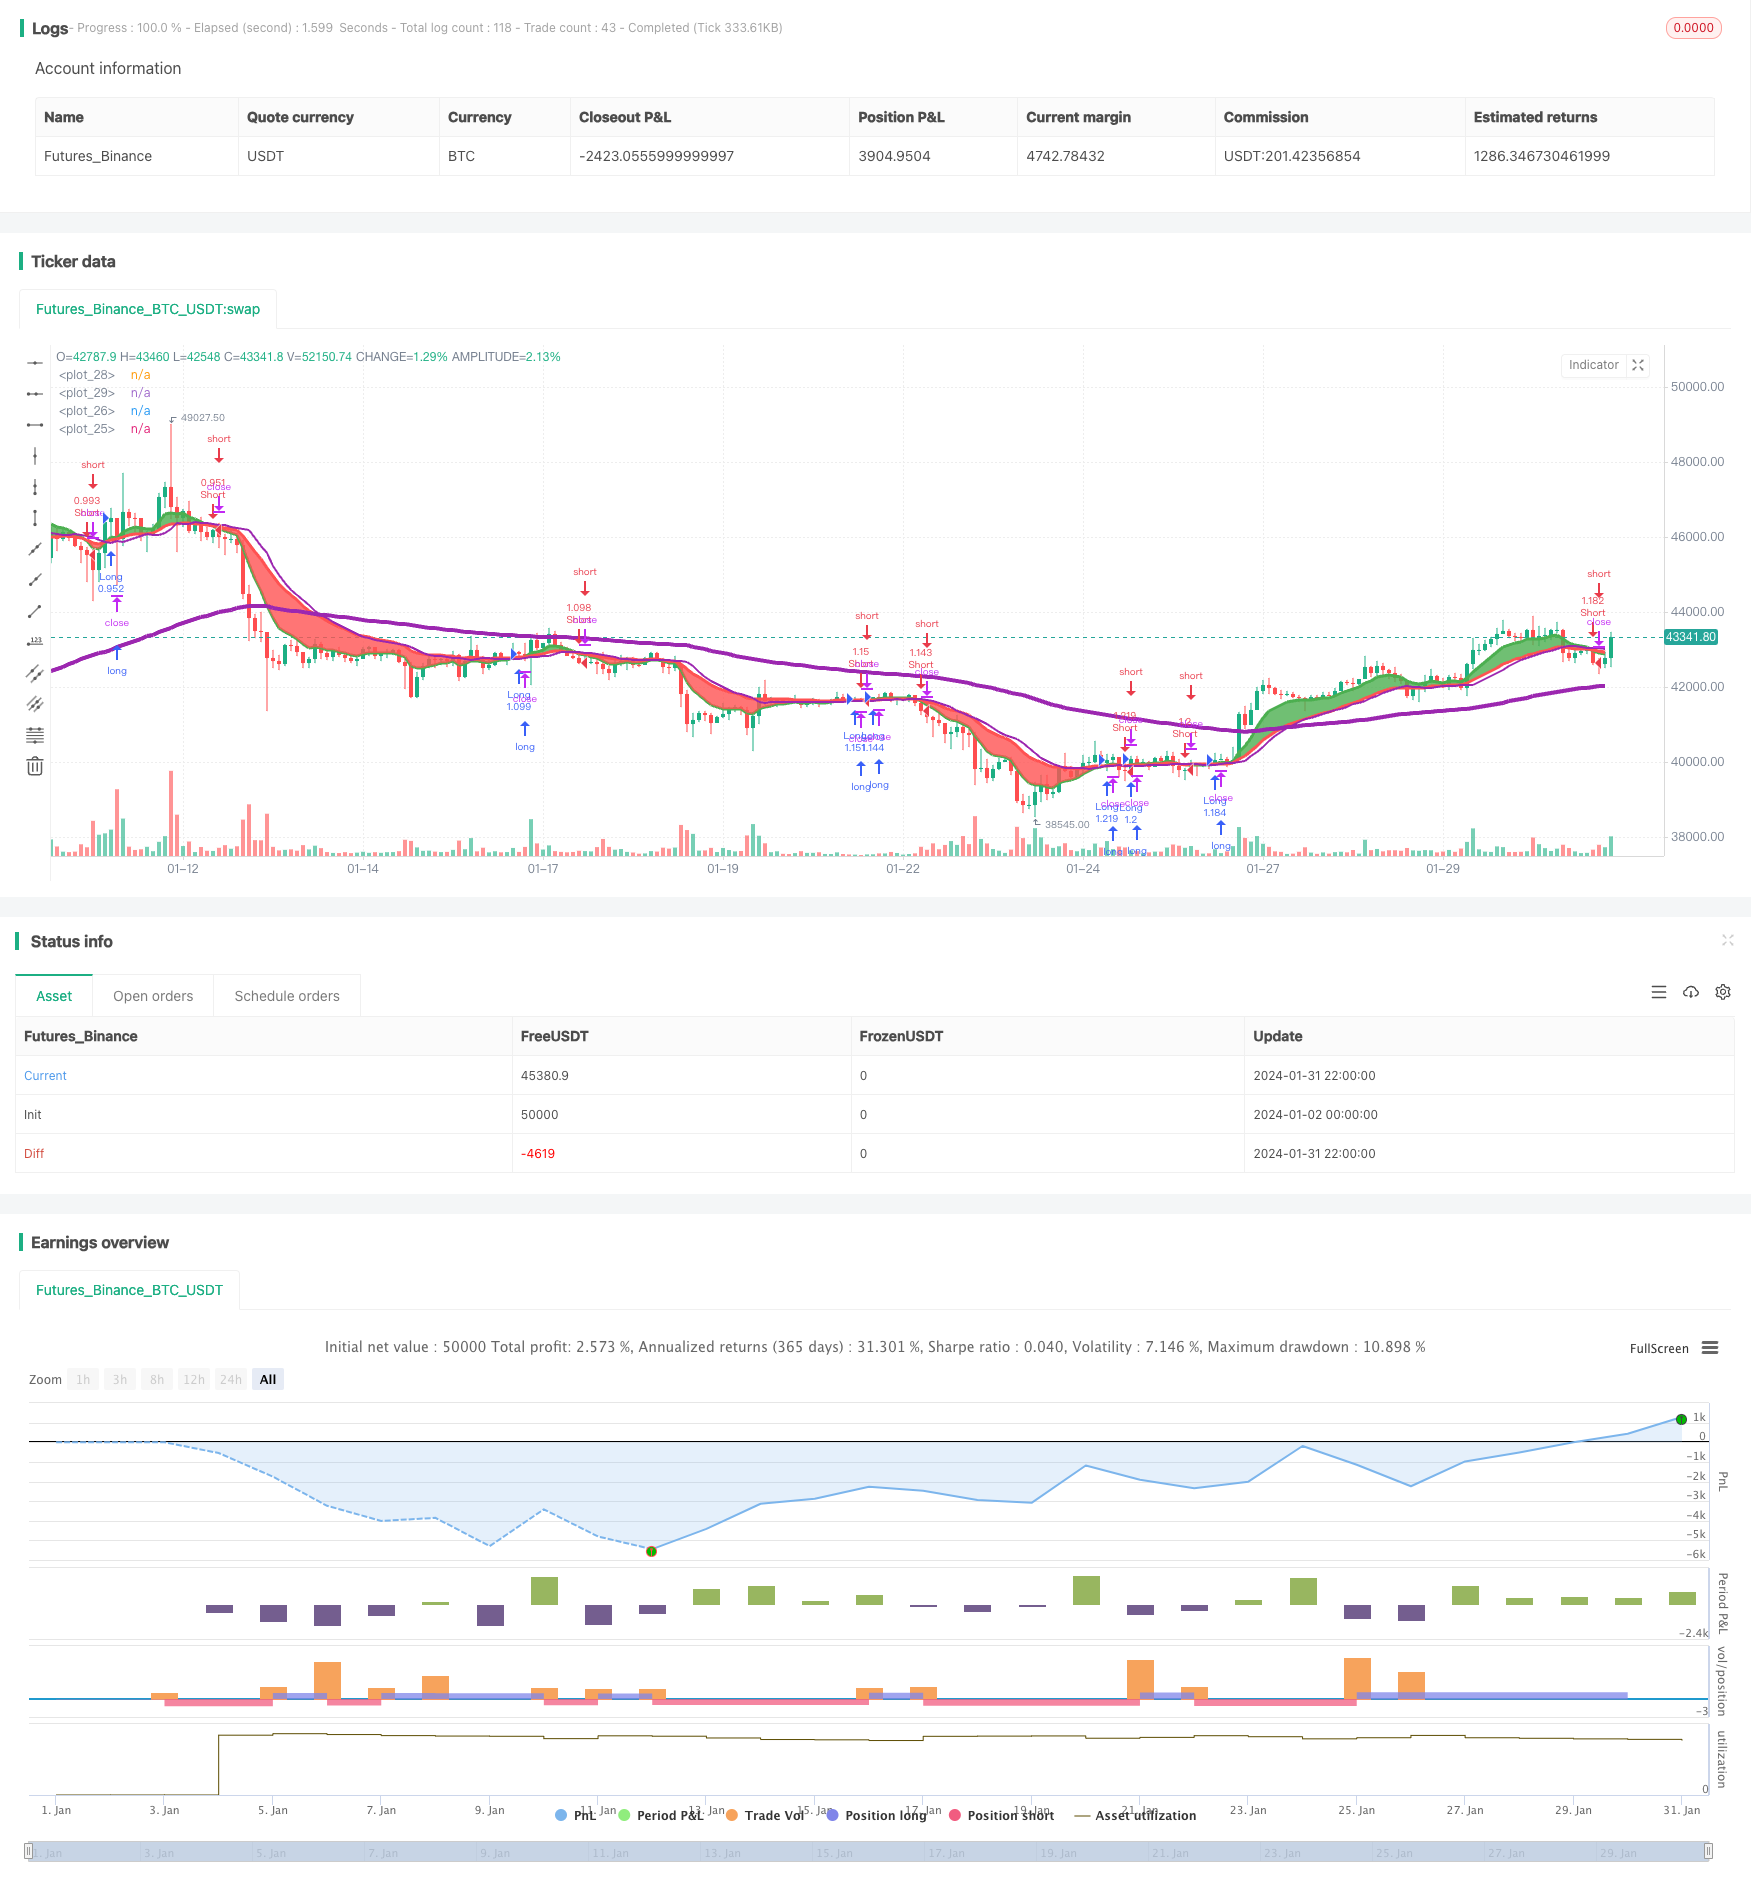
/*backtest
start: 2024-01-02 00:00:00
end: 2024-02-01 00:00:00
period: 2h
basePeriod: 15m
exchanges: [{"eid":"Futures_Binance","currency":"BTC_USDT"}]
*/

// This source code is subject to the terms of the Mozilla Public License 2.0 at https://mozilla.org/MPL/2.0/
// © TradersPostInc

//@version=5
strategy('TradersPost Example MOMO Strategy', overlay=true, default_qty_value=100, initial_capital=100000, default_qty_type=strategy.percent_of_equity, pyramiding=0)

startTime = input(defval = timestamp('01 Jan 2021 00:00 +0000'), title = 'Start Time', group = 'Date Range')
endTime = input(defval = timestamp('31 Dec 2023 23:59 +0000'), title = 'End Time', group = 'Date Range')
timeCondition = true
timeConditionEnd = timeCondition[1] and not timeCondition

fastEmaLength = input.int(defval = 8, title = 'Fast EMA Length')
slowEmaLength = input.int(defval = 21, title = 'Slow EMA Length')
sides = input.string(defval = 'Both', title = 'Sides', options = ['Long', 'Short', 'Both', 'None'])

fastEma = ta.ema(close, fastEmaLength)
slowEma = ta.ema(close, slowEmaLength)

isUptrend = fastEma >= slowEma
isDowntrend = fastEma <= slowEma
trendChanging = ta.cross(fastEma, slowEma)

ema105 = request.security(syminfo.tickerid, '30', ta.ema(close, 105)[1], barmerge.gaps_off, barmerge.lookahead_on)
ema205 = request.security(syminfo.tickerid, '30', ta.ema(close, 20)[1], barmerge.gaps_off, barmerge.lookahead_on)
plot(ema105, linewidth=4, color=color.new(color.purple, 0), editable=true)
plot(ema205, linewidth=2, color=color.new(color.purple, 0), editable=true)

aa = plot(fastEma, linewidth=3, color=color.new(color.green, 0), editable=true)
bb = plot(slowEma, linewidth=3, color=color.new(color.red, 0), editable=true)
fill(aa, bb, color=isUptrend ? color.green : color.red, transp=90)

tradersPostBuy = trendChanging and isUptrend and timeCondition
tradersPostSell = trendChanging and isDowntrend and timeCondition

pips = syminfo.pointvalue / syminfo.mintick

percentOrPipsInput = input.string('Percent', title='Percent or Pips', options=['Percent', 'Pips'])

stopLossLongInput = input.float(defval=0, step=0.01, title='Stop Loss Long', minval=0)
stopLossShortInput = input.float(defval=0, step=0.01, title='Stop Loss Short', minval=0)

takeProfitLongInput = input.float(defval=0, step=0.01, title='Target Profit Long', minval=0)
takeProfitShortInput = input.float(defval=0, step=0.01, title='Target Profit Short', minval=0)

stopLossPriceLong = ta.valuewhen(tradersPostBuy, close, 0) * (stopLossLongInput / 100) * pips
stopLossPriceShort = ta.valuewhen(tradersPostSell, close, 0) * (stopLossShortInput / 100) * pips

takeProfitPriceLong = ta.valuewhen(tradersPostBuy, close, 0) * (takeProfitLongInput / 100) * pips
takeProfitPriceShort = ta.valuewhen(tradersPostSell, close, 0) * (takeProfitShortInput / 100) * pips

takeProfitALong = takeProfitLongInput > 0 ? takeProfitLongInput : na
takeProfitBLong = takeProfitPriceLong > 0 ? takeProfitPriceLong : na

takeProfitAShort = takeProfitShortInput > 0 ? takeProfitShortInput : na
takeProfitBShort = takeProfitPriceShort > 0 ? takeProfitPriceShort : na

stopLossALong = stopLossLongInput > 0 ? stopLossLongInput : na
stopLossBLong = stopLossPriceLong > 0 ? stopLossPriceLong : na

stopLossAShort = stopLossShortInput > 0 ? stopLossShortInput : na
stopLossBShort = stopLossPriceShort > 0 ? stopLossPriceShort : na

takeProfitLong = percentOrPipsInput == 'Pips' ? takeProfitALong : takeProfitBLong
stopLossLong = percentOrPipsInput == 'Pips' ? stopLossALong : stopLossBLong
takeProfitShort = percentOrPipsInput == 'Pips' ? takeProfitAShort : takeProfitBShort
stopLossShort = percentOrPipsInput == 'Pips' ? stopLossAShort : stopLossBShort

buyAlertMessage = '{"ticker": "' + syminfo.ticker + '", "action": "buy", "price": ' + str.tostring(close) + '}'
sellAlertMessage = '{"ticker": "' + syminfo.ticker + '", "action": "sell", "price": ' + str.tostring(close) + '}'

exitLongAlertMessage = '{"ticker": "' + syminfo.ticker + '", "action": "exit", "price": ' + str.tostring(close) + '}'
exitShortAlertMessage = '{"ticker": "' + syminfo.ticker + '", "action": "exit", "price": ' + str.tostring(close) + '}'

if (sides != "None")
    if tradersPostBuy
        strategy.entry('Long', strategy.long, when = sides != 'Short', alert_message = buyAlertMessage)
        strategy.close('Short', when = sides == "Short" and timeCondition, alert_message = exitShortAlertMessage)

    if tradersPostSell
        strategy.entry('Short', strategy.short, when = sides != 'Long', alert_message = sellAlertMessage)
        strategy.close('Long', when = sides == 'Long', alert_message = exitLongAlertMessage)

exitAlertMessage = '{"ticker": "' + syminfo.ticker + '", "action": "exit"}'

strategy.exit('Exit Long', from_entry = "Long", profit = takeProfitLong, loss = stopLossLong, alert_message = exitAlertMessage)
strategy.exit('Exit Short', from_entry = "Short", profit = takeProfitShort, loss = stopLossShort, alert_message = exitAlertMessage)

strategy.close_all(when = timeConditionEnd)