概述
本策略基于Doji星形态,当出现Doji星形态时,在Doji星高点和前一根K线高点之间放置买入停止单,在Doji星低点和前一根K线低点之间放置卖出停止单。当价格触发停止单后,可选择以固定止损止盈出场,或以Doji星形态的最高价和最低价作为止损止盈出场。该策略适合在高时间框架如日线和周线运行,可有效过滤噪音。
策略原理
当出现Doji星形态时,说明当前的供求关系发生变化,买卖双方力量趋于平衡,价格可能出现反转。该策略正是利用Doji星形态预示的价格反转信号,通过放置停止单捕捉反转机会。具体来说,判断Doji星形态的条件是:
body=close-open
range=high-low
abody=abs(body)
ratio=abody/range
data=(abs(open - close) <= (high - low) * Doji)
如果abs(open-close) <= (high-low)*Doji参数,则判定为Doji星形态,此时放置停止单。停止单的位置如下:
longDist= longcandle[1] and range[1]>range? high: max(high,high[1])
shortDist= longcandle[1] and range[1]>range? low: min(low,low[1])
如果前一根K线实体较大,则买入停止单位于Doji星高点和前一根K线高点之间。如果前一根K线实体较小,则买入停止单为Doji星高点。卖出停止单同理。
出场规则有两种可选:
- 以固定止盈止损出场
strategy.exit("exit buy","buy stop",loss=SL, profit=TP, when=Use_SL_TP)
- 以Doji星最高价最低价作为止盈止损出场
strategy.close("buy stop",when=not Use_SL_TP and close<dojilow)
优势分析
该策略具有以下优势:
- 操作简单,容易实施。
- 利用Doji星高效的价格反转信号,捕捉反转机会。
- 可配置止损止盈参数,控制风险。
- 适合高时间框架运行,可过滤噪音。
风险分析
该策略也存在一定的风险:
- Doji星形态不一定会带来价格反转,可能出现止损。解决方法是合理设置止损距离,控制单笔损失。
- 在低时间框架上运行时,Doji信号可能存在过多噪音。解决方法是只在高时间框架如日线周线运行。
- 如果不设置止损止盈,存在无限亏损的风险。解决方法是正确使用止损止盈功能。
优化方向
该策略可以从以下几个方向进行优化:
- 优化Doji参数,找到不同交易品种最佳参数组合。
- 测试不同的止损止盈参数,找到最佳参数组合。
- 基于ATR动态计算止损距离。
- 结合其他指标确定最佳入场时机。
总结
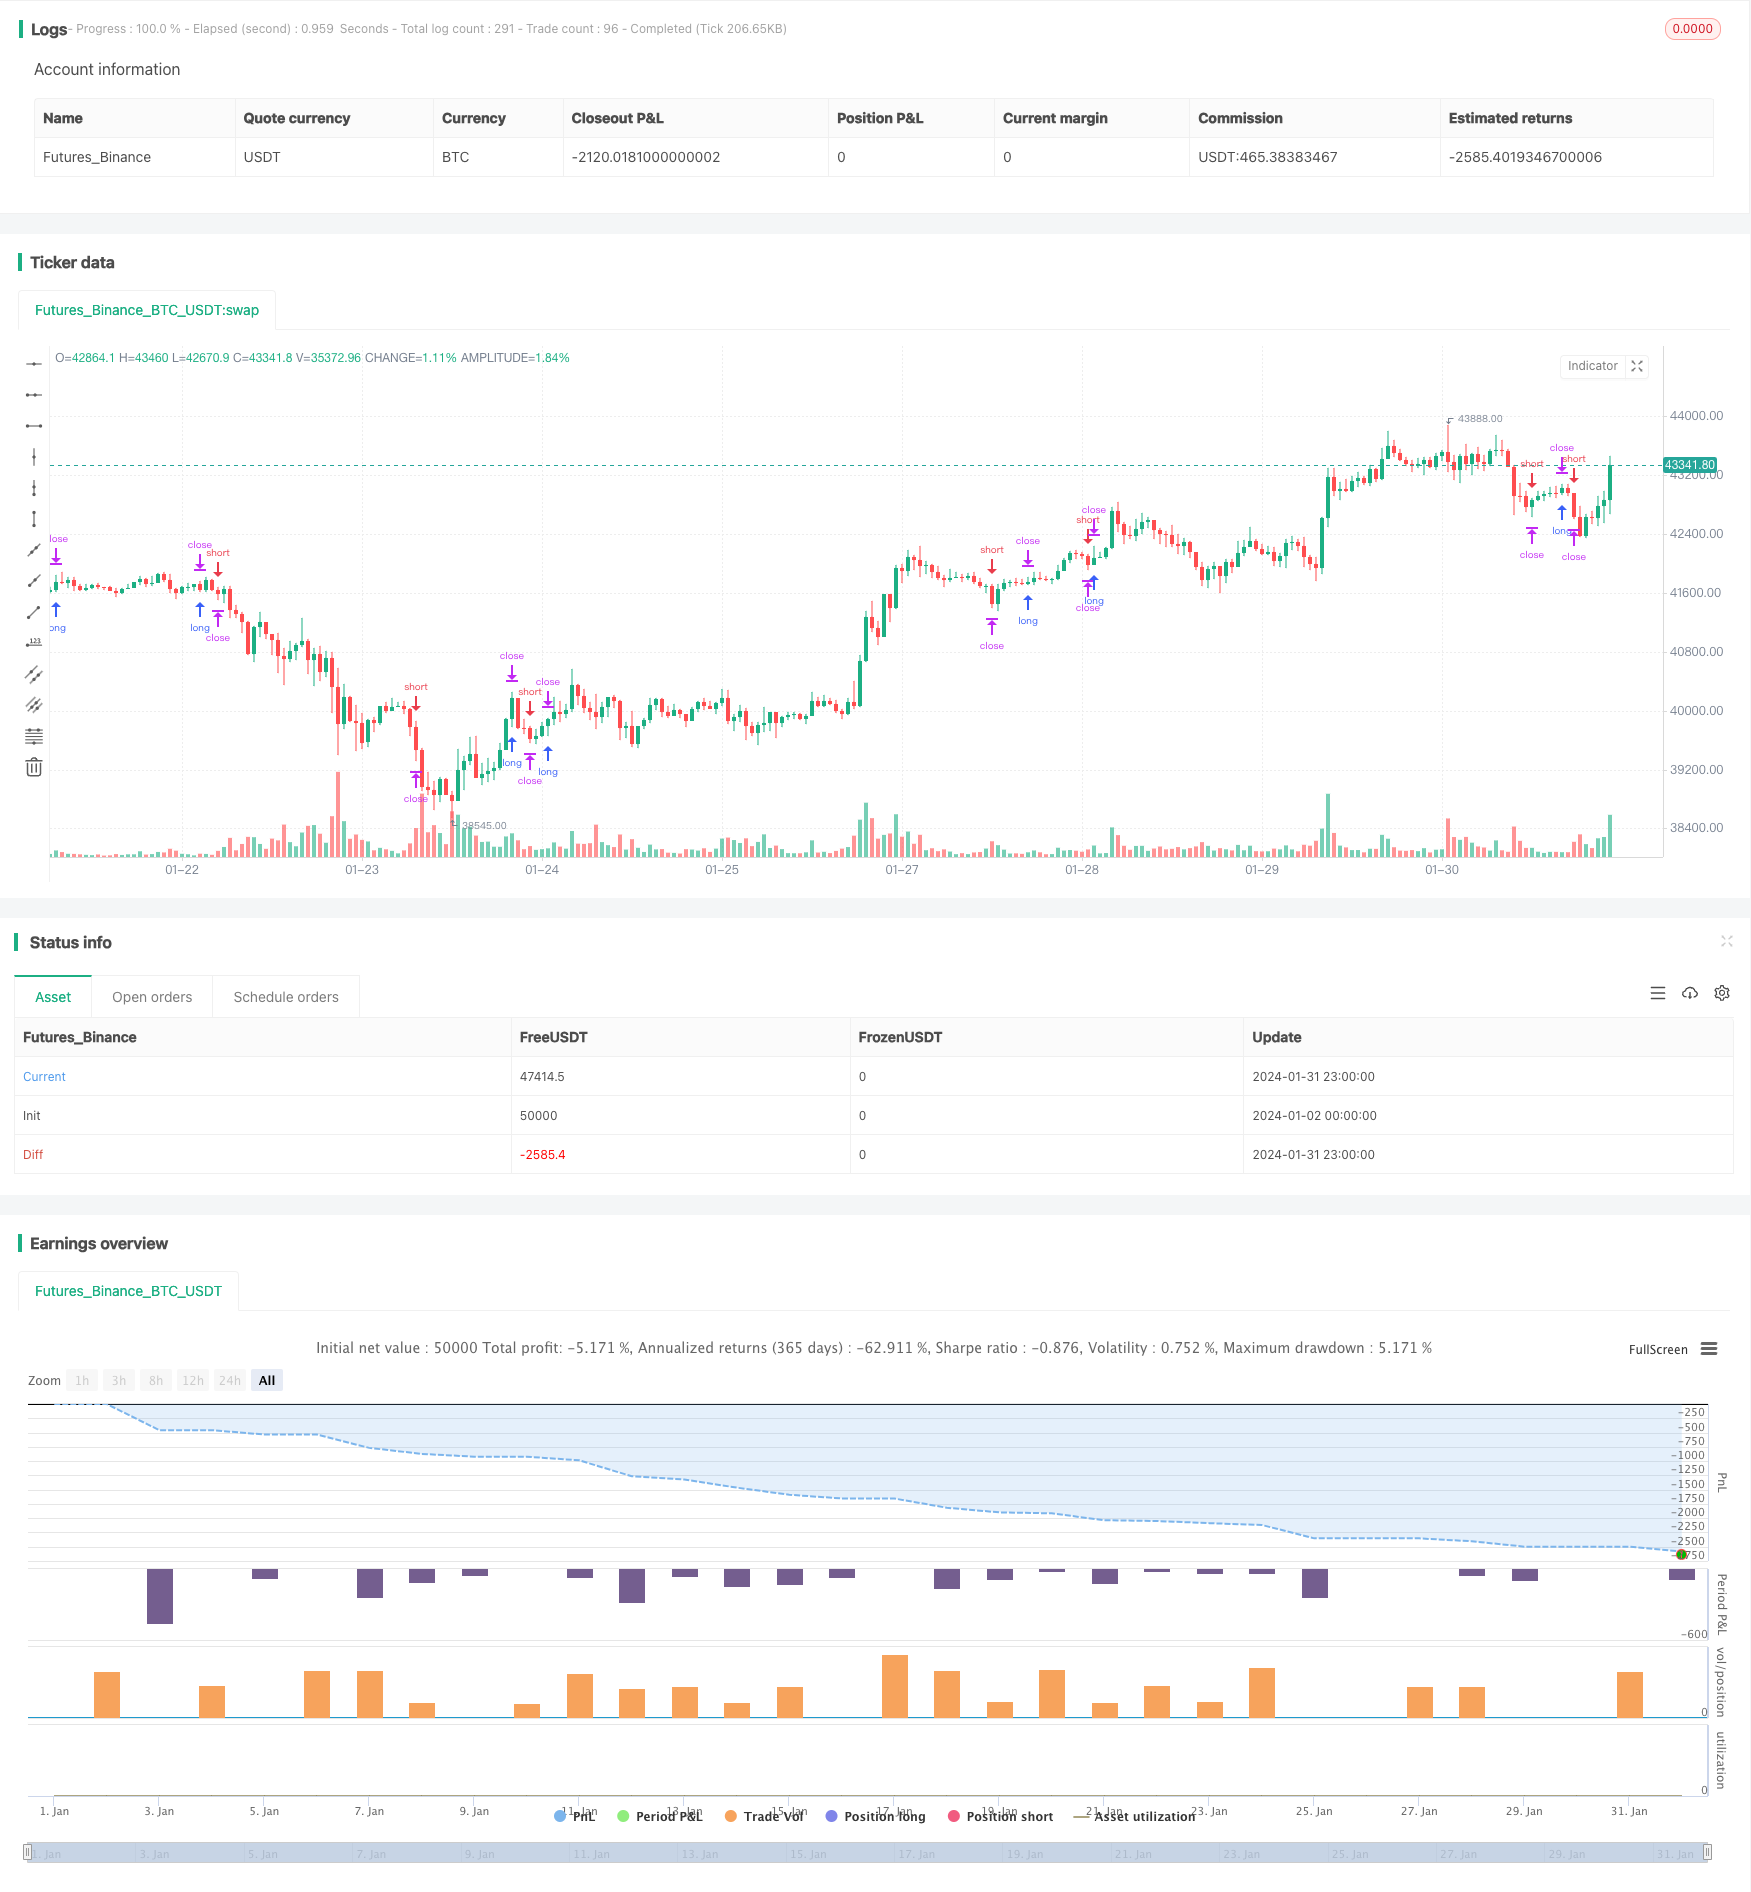
该策略整体运行效果良好,通过捕捉Doji价格反转机会,可以获得不错的交易信号。同时策略操作简单,容易实施,适合多种交易品种,是一款实用的量化交易策略。通过持续测试和优化,可望获得更好的策略效果。
策略源码
/*backtest
start: 2024-01-02 00:00:00
end: 2024-02-01 00:00:00
period: 1h
basePeriod: 15m
exchanges: [{"eid":"Futures_Binance","currency":"BTC_USDT"}]
*/

//@version=3
//This is a simple strategy based on Doji star candlestick
//It places two orders: buy stop at doji star high or previous candle high and sell stop at doji star low or previous candle low.
//This strategy works very well with high time frames like Weekly TF because it eliminates the noise in doji formation.
//

strategy("Doji strategy W", overlay=true, calc_on_every_tick=true, pyramiding=0,default_qty_type=strategy.percent_of_equity,default_qty_value=100,currency=currency.USD)

//INPUTS
//MinDistance=input(100,'Minimum distance in ticks')
Use_SL_TP=input(true,'Use stop loss and take profit?')
TP=input(200,'Take Profit in ticks')
SL=input(200,'Stop Loss in tiks')
Doji = input(0.05, minval=0.01, title="Doji size", step=0.01)

//VARIABILI
body=close-open
range=high-low
abody=abs(body)
ratio=abody/range
longcandle= (ratio>0.6)

//Doji
data=(abs(open - close) <= (high - low) * Doji)
plotchar(data, title="Doji", text='Doji', color=black)
longDist= longcandle[1] and range[1]>range? high: max(high,high[1])
shortDist= longcandle[1] and range[1]>range? low: min(low,low[1])
dojilow=data==1?low:na
dojihigh=data==1?high:na

goStar=data==1?true:false
//////////////////////////////////////////////////////////////////

//STRATEGY

strategy.order("buy stop",true,stop=longDist,  oca_name="Dojy Entry",when=goStar)
strategy.order("sell stop",false,stop=shortDist, oca_name="Dojy Entry",when=goStar)

strategy.exit("exit buy","buy stop",loss=SL, profit=TP, when=Use_SL_TP)
strategy.exit("exit sell","sell stop",loss=SL,profit=TP, when=Use_SL_TP)

strategy.close("buy stop",when=not Use_SL_TP and close<dojilow)
strategy.exit("exit buy","buy stop",profit=TP, when=not Use_SL_TP)
strategy.close("sell stop",when=not Use_SL_TP and close>dojihigh)
strategy.exit("exit sell","sell stop",profit=TP, when=not Use_SL_TP)