概述
双向突破均线交易策略是一个基于多个指标进行买入和卖出信号判断的策略。它整合了均线、支撑压力指标、趋势指标以及超买超卖指标,形成一个全方位的交易体系。
策略原理
买入信号的判断逻辑
买入信号需要同时满足以下四个条件:
- 收盘价高于抛物线指标
- 收盘价高于Length=200的简单移动平均线
- MACD指标的MACD线高于0
- Length=7的RSI指标高于50
只要上述四个条件同时满足,就产生1的买入信号。
卖出信号的判断逻辑
卖出信号的判断逻辑和买入信号正好相反,需要同时满足以下四个条件:
- 收盘价低于抛物线指标
- 收盘价低于Length=200的简单移动平均线
- MACD指标的MACD线低于0
- Length=7的RSI指标低于50
一旦上述四个条件同时满足,就产生-1的卖出信号。
入场和出场
策略中,入场条件根据买入和卖出信号判断,做多时要求买入信号=1,做空时要求卖出信号=-1。
出场条件有两个,一个是快速出场,一旦信号改变就出场;另一个是等待相反信号才出场,比如做多后等待卖出信号才平仓。
策略优势分析
双向突破均线策略最大的优势在于多指标组合,能够全方位判断趋势、超买超卖状态等情况。具体来说,主要有以下几点优势:
- 抛物线指标能判断是否有效突破作为支撑压力;
- 均线判断大趋势方向,避免逆势操作;
- MACD判断明确的多空状态;
- RSI避免了超买超卖的风险;
- 结合多指标,可以大幅提高稳定性和成功率。
总的来说,这套系统非常适合新手自我学习,也适合专业人员使用。
风险分析
尽管双向突破均线策略有很多优势,但也存在一些风险需要关注,主要集中在以下几个方面:
- 参数设置易造成过度优化,实盘效果可能不理想;
- 指标发散的概率较大,入场前后需要再次确认;
- 止损策略不完善,容易被套牢;
- 交易频率可能过高,增加交易成本和滑点损耗。
针对以上风险,可以采取如下措施加以优化和改进:
- 增加指标过滤,确保一致信号;
- 严格止损,控制单笔损失;
- 交易次数控制,合理频率;
- 参数组合测试,防止过优化。
优化方向
双向突破均线策略还有很大的优化空间,主要可以从以下几个方面入手:
- 增加机器学习模型预测信号强度;
- 结合文本分析等判断重大消息面影响;
- 增加市场结构指标,根据阶段调整策略;
- 优化止损方式,跟踪止损或振荡止损;
- 参数调整与组合,找到最优参数对。
如果能在上述方面有所改进,相信该策略的效果能得到进一步提升,更适合实盘应用。
总结
双向突破均线交易策略是一种多指标组合的全能策略。它同时结合了趋势、支持压力、超买超卖等指标判断买入卖出时机。具有指标效果互补、全面判断的优势。但也存在一定的风险,需要继续优化以适应更多市场情况。总体而言,该策略为人类量化交易提供了一个非常Outstanding的策略思路,值得深入研究与应用。
策略源码
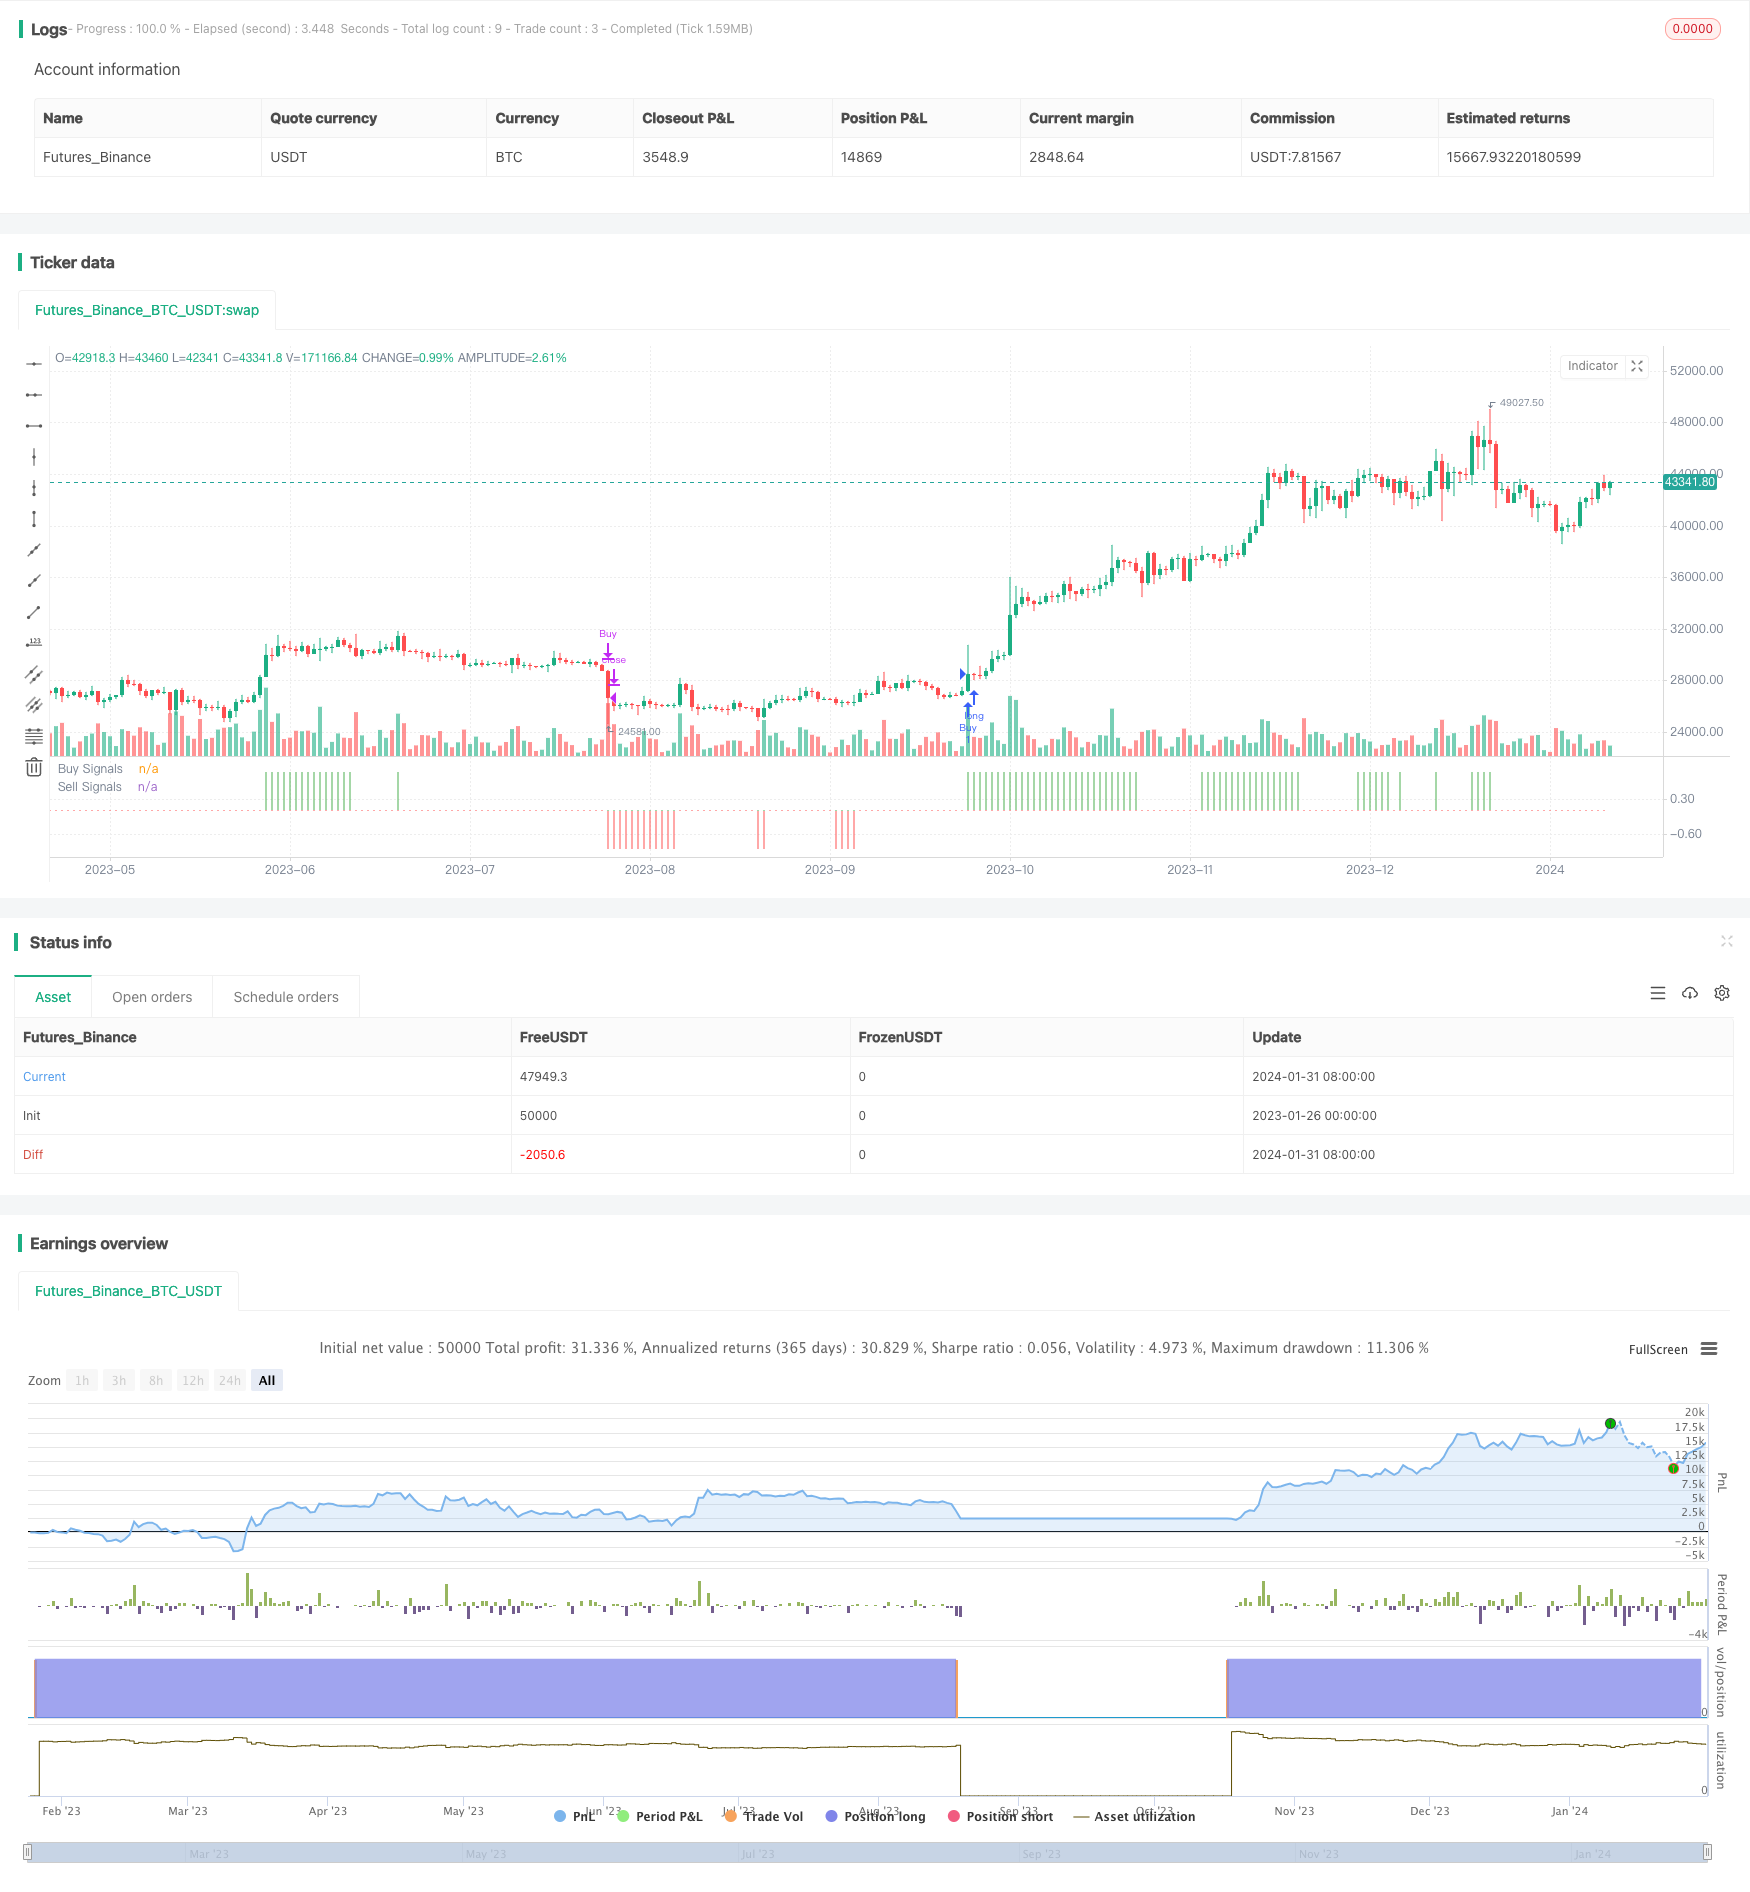
/*backtest
start: 2023-01-26 00:00:00
end: 2024-02-01 00:00:00
period: 1d
basePeriod: 1h
exchanges: [{"eid":"Futures_Binance","currency":"BTC_USDT"}]
*/

//@version=4
//Original Indicator by @Shizaru - simply made into a strategy!

strategy("Simple Buy/Sell Strategy", overlay=false)
psar = sar(0.02,0.02,0.2)
c1a = close > psar
c1v = close < psar

malen = input(200, title="MA Length")
mm200 = sma(close, malen)
c2a = close > mm200
c2v = close < mm200

fast = input(12, title="Fast EMA Length")
slow = input(26, title="Slow EMA Length")
[macd,signal,hist] = macd(close, fast,slow, 9)
c3a = macd >= 0
c3v = macd <= 0

rsilen = input(7, title="RSI Length")
th = input(50, title="RSI Threshold")
rsi14 = rsi(close, rsilen)
c4a = rsi14 >= th
c4v = rsi14 <= th

buy = c1a and c2a and c3a and c4a ? 1 : 0
sell = c1v and c2v and c3v and c4v ? -1 : 0

longtrades = input(true, title="Long Trades")
shorttrades = input(false, title="Short Trades")
quickexit = input(false, title="Quick Exits")

strategy.entry("Buy", strategy.long, when=buy==1 and longtrades==true)
strategy.close("Buy", when=quickexit==true ? buy==0 : sell==-1)
strategy.entry("Sell", strategy.short, when=sell==-1 and shorttrades==true)
strategy.close("Sell", when=quickexit==true ? sell==0 : buy==1)

plot(buy, style=plot.style_histogram, color=color.green, linewidth=3, title="Buy Signals")
plot(sell, style=plot.style_histogram, color=color.red, linewidth=3, title="Sell Signals")