概述
该策略主要利用了14和28日的简单移动平均线形成的黄金交叉和死亡交叉进行反转操作。当快均线从下方向上突破慢均线时,表明行情开始反转,可以建立多头仓位;当快均线从上方向下跌破慢均线时,表明行情开始反转,可以建立空头仓位。
由于其利用简单移动平均线来判断市场趋势变化的原理,我将该策略命名为“基于双均线的长线反转策略”。
策略原理
该策略的核心逻辑在于利用 14 日和 28 日两条不同期限的简单移动平均线来判断市场趋势,具体规则如下:
定义快线为 14 日简单移动平均线,慢线定义为 28 日简单移动平均线。
当快线从下方向上突破慢线时,为多头信号,做多入场。
当快线从上方向下跌破慢线时,为空头信号,做空入场。
做多/做空后,快线重新跌破慢线时,为平仓信号。
该策略同时结合止损、止盈、跟踪止盈进行风险管理。针对做多和做空情况,分别定义了长仓止损价格、做多止盈价格、做空止盈价格、长仓跟踪止盈价格。这些参数都通过百分比形式设置,使策略更加灵活。
优势分析
- 利用双均线判断市场主要趋势的策略,原理简单清晰,容易理解和验证。
- 快慢均线的周期设置为 14 和 28 日 ,分别代表短期和中期趋势转换,能较好发现反转机会。
- 结合止盈、止损和跟踪止盈来控制风险,使盈利能够锁定,避免亏损扩大。
- 可同时做多做空,满足不同市场环境的需要。
风险与改进
- 双均线交叉具有一定滞后性,可能错过最佳入场时机。
- 长短均线交叉容易发生误信号,应避免设置太短的均线周期。
- 停损距离设置太小可能增加止损被冲击的概率。应根据不同品种合理设置止损距离。
- 可引入更多指标进行组合,提高策略的稳健性。例如加入布林带判定趋势,或引入MACD校验入场时机。
优化方向
- 测试不同的均线参数组合,寻找更匹配该品种特性的均线周期。
- 测试不同的止损距离设置,找到最优止损位置。
- 测试加入其他指标进行优化,寻找最优参数组合以减少误信号。
- 优化仓位管理规则,使盈利更加丰厚。
总结
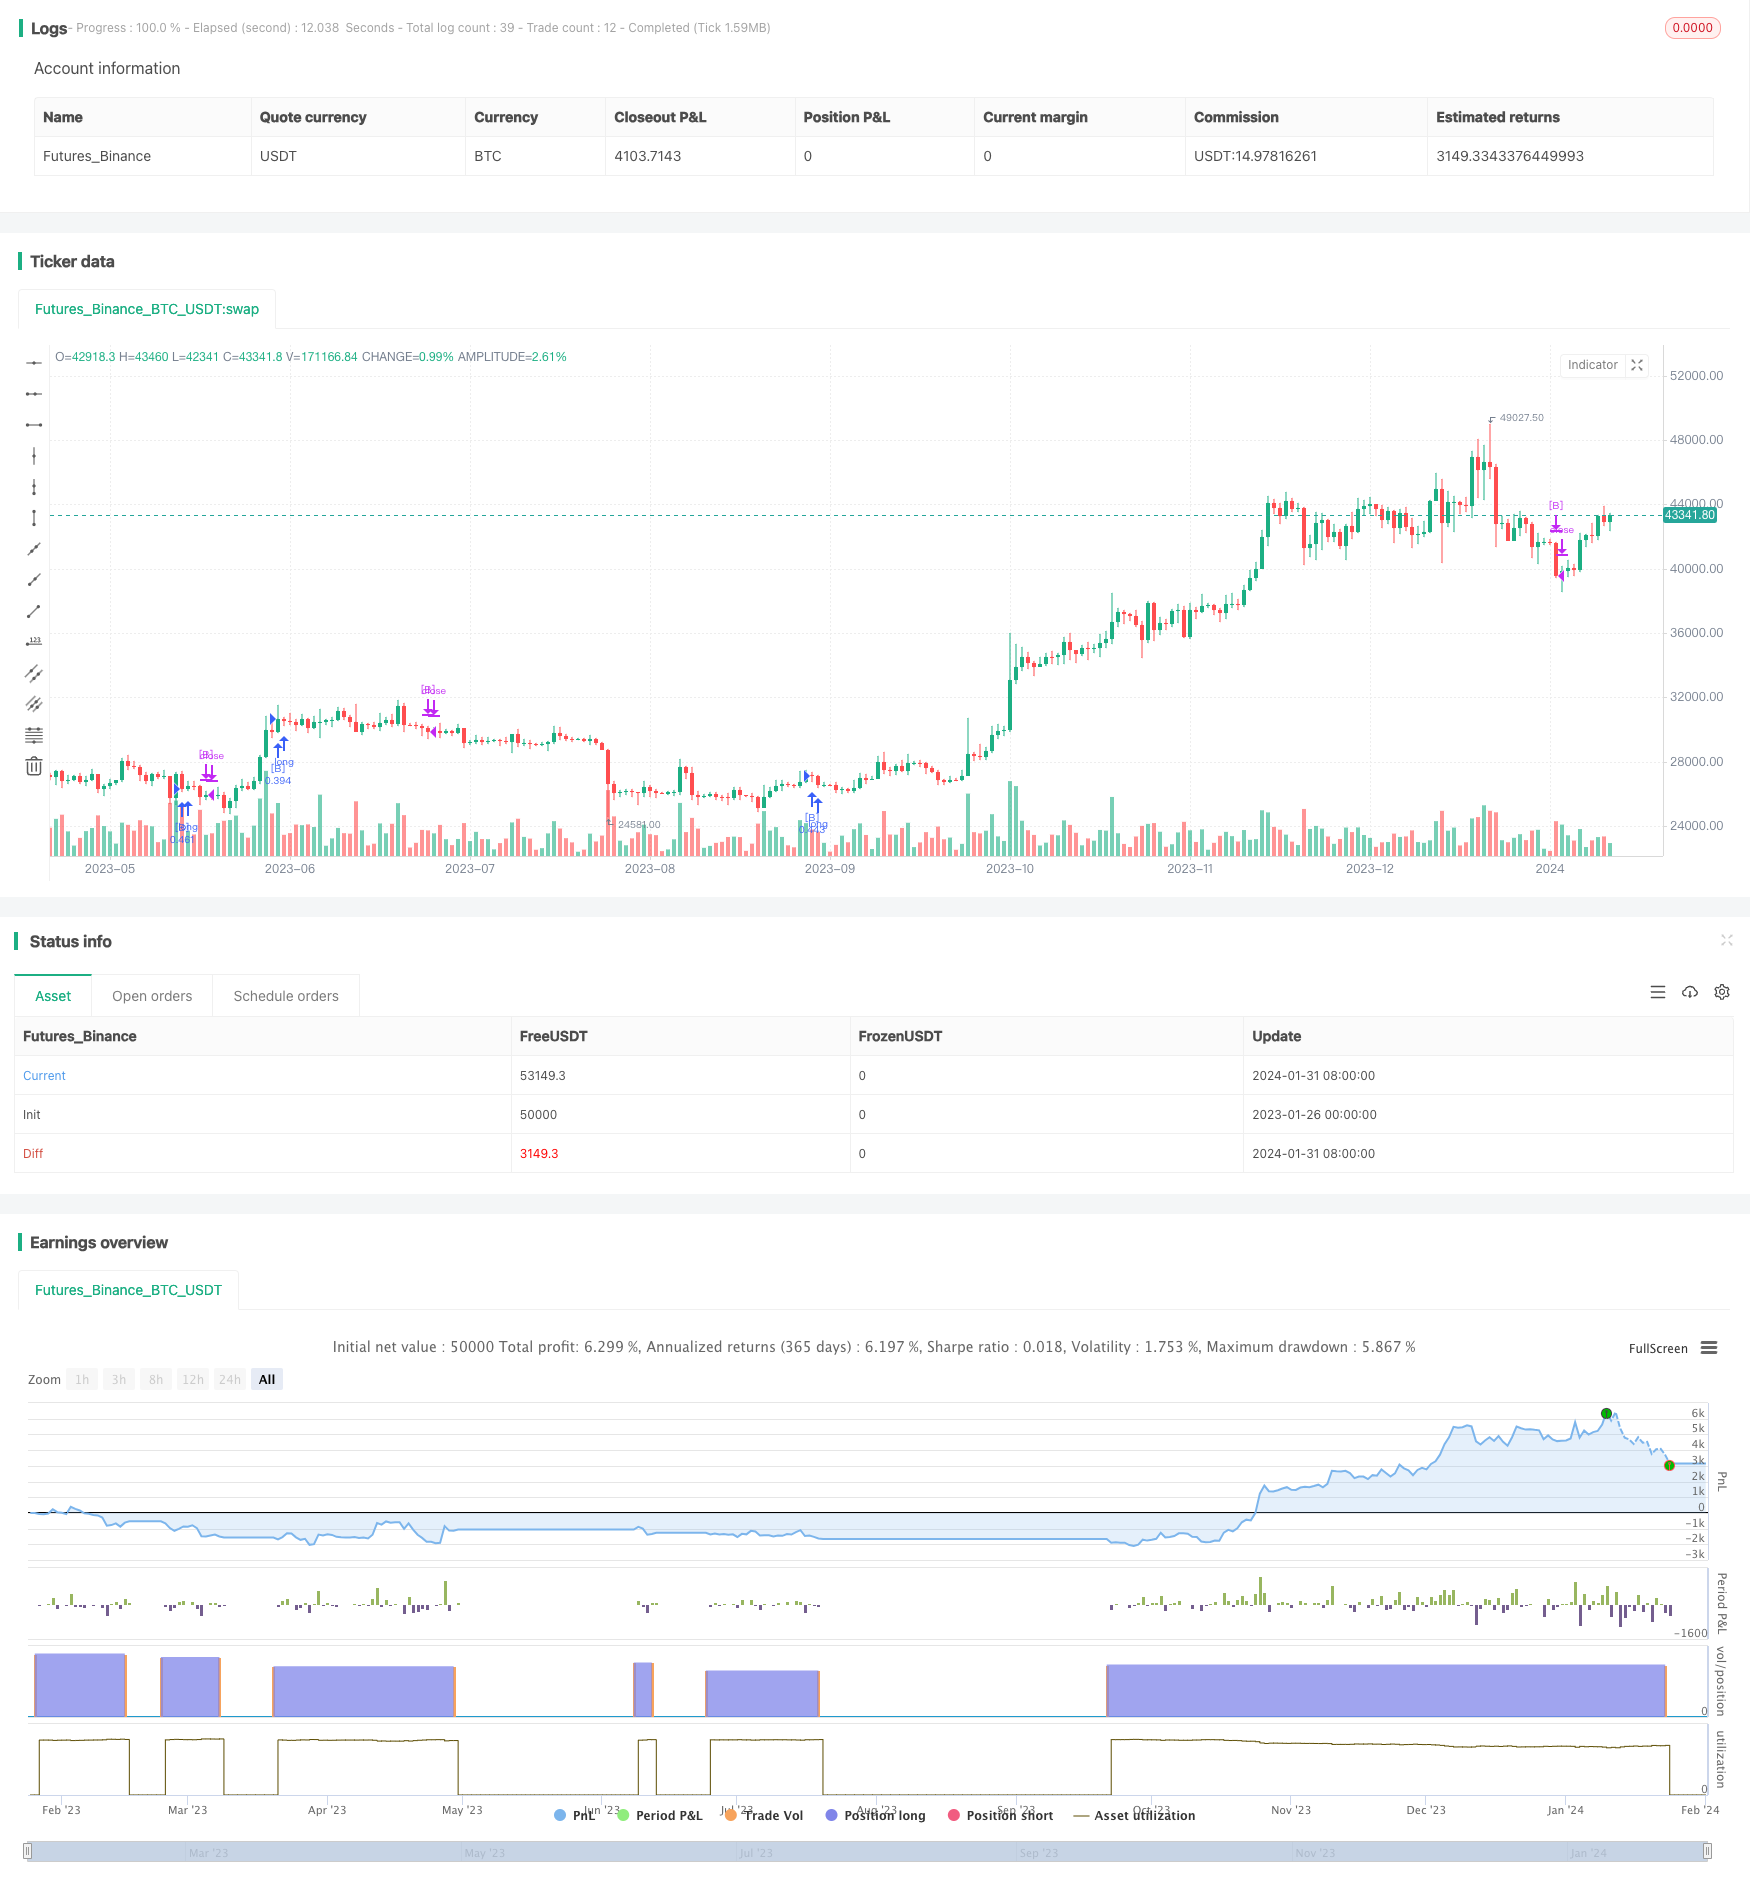
该策略整体来说是一个非常经典的基于双均线判断趋势反转的策略。它有着操作原理简单,较易掌握等优势;同时也存在一些后期可以持续优化的方向。总体而言,该策略从原理和操作上都较为成熟,是量化交易的一个很好的入门策略。
策略源码
/*backtest
start: 2023-01-26 00:00:00
end: 2024-02-01 00:00:00
period: 1d
basePeriod: 1h
exchanges: [{"eid":"Futures_Binance","currency":"BTC_USDT"}]
*/

// This source code is subject to the terms of the Mozilla Public License 2.0 at https://mozilla.org/MPL/2.0/
// © ruckard

//@version=4

// Current version: v20201031 ( A061 )
// Tradingview Public description - BEGIN
//
// This strategy serves as a beginner's guide to connect TradingView signals to Zignaly Crypto Trading Platform.
//
// It was originally tested at BTCUSDT pair and 1D timeframe.
// The strategy is a slightly modified copy of default TradingView strategy that appears when you create a blank new strategy.
// It decides to go long when 14-period SMA crosses over 28-period SMA and goes short when 14-period SMA crosses under 28-period SMA.
//
// Before using this documentation it's recommended that you:
// [LIST]
// [*] Use default TradingView strategy script or another script and setup its associated alert manually. Just make the alert pop-up in the screen.
// [*] Create a 'Copy-Trader provider' (or Signal Provider) in Zignaly and send signals to it either thanks to your browser or with some basic programming.
// [/LIST]

// [B]SETTINGS[/B]
// [B]__ SETTINGS - Capital[/B]
// [LIST]
// [*] (CAPITAL) Capital quote invested per order in USDT units {100.0}. This setting is only used when '(ZIG) Provider type' is set to 'Signal Provider'.
// [*] (CAPITAL) Capital percentage invested per order (%) {25.0}. This setting is only used when '(ZIG) Provider type' is set to 'Copy Trader Provider'.
// [/LIST]
// [B]__ SETTINGS - Misc[/B]
// [LIST]
// [*] (ZIG) Enable Alert message {True}: Whether to enable alert message or not.
// [*] (DEBUG) Enable debug on order comments {True}: Whether to show alerts on order comments or not.
// [*] Number of decimal digits for Prices {2}.
// [*] (DECIMAL) Maximum number of decimal for contracts {3}.
// [/LIST]
// [B]__ SETTINGS - Zignaly[/B]
// [LIST]
// [*] (ZIG) Integration type {TradingView only}: [b]Hybrid[/b]: Both TradingView and Zignaly handle take profit, trailing stops and stop losses. Useful if you are scared about TradingView not firing an alert. It might arise problems if TradingView and Zignaly get out of sync. [b]TradingView only[/b]: TradingView sends entry and exit orders to Zignaly so that Zignaly only buys or sells. Zignaly won't handle stop loss or other settings on its own.
// [*] (ZIG) Zignaly Alert Type {WebHook}: 'Email' or 'WebHook'.
// [*] (ZIG) Provider type {Copy Trader Provider}: 'Copy Trader Provider' or 'Signal Provider'. 'Copy Trader Provider' sends a percentage to manage. 'Signal Provider' sends a quote to manage.
// [*] (ZIG) Exchange: 'Binance' or 'Kucoin'.
// [*] (ZIG) Exchange Type {Spot}: 'Spot' or 'Futures'.
// [*] (ZIG) Leverage {1}. Set it to '1' when '(ZIG) Exchange Type' is set to 'Spot'.
// [/LIST]
// [B]__ SETTINGS - Strategy[/B]
// [LIST]
// [*] (STRAT) Strategy Type: 'Long and Short', 'Long Only' or 'Short Only'.
// [*] (STOPTAKE) Take Profit? {false}: Whether to enable Take Profit.
// [*] (STOPTAKE) Stop Loss? {True}: Whether to enable Stop Loss.
// [*] (TRAILING) Enable Trailing Take Profit (%) {True}: Whether to enable Trailing Take Profit.
// [*] (STOPTAKE) Take Profit % {3.0}: Take profit percentage. This setting is only used when '(STOPTAKE) Take Profit?' setting is set to true.
// [*] (STOPTAKE) Stop Loss % {2.0}: Stop loss percentage. This setting is only used when '(STOPTAKE) Stop Loss?' setting is set to true.
// [*] (TRAILING) Trailing Take Profit Trigger (%) {2.5}: Trailing Stop Trigger Percentage. This setting is only used when '(TRAILING) Enable Trailing Take Profit (%)' setting is set to true.
// [*] (TRAILING) Trailing Take Profit as a percentage of Trailing Take Profit Trigger (%) {25.0}: Trailing Stop Distance Percentage. This setting is only used when '(TRAILING) Enable Trailing Take Profit (%)' setting is set to true.
// [*] (RECENT) Number of minutes to wait to open a new order after the previous one has been opened {6}.
// [/LIST]

// [B]DEFAULT SETTINGS[/B]

// By default this strategy has been setup with these beginner settings:
// [LIST]
// [*] '(ZIG) Integration type' : TradingView only
// [*] '(ZIG) Provider type'    : 'Copy Trader Provider'
// [*] '(ZIG) Exchange'         : 'Binance'
// [*] '(ZIG) Exchange Type'    : 'Spot'
// [*] '(STRAT) Strategy Type'  : 'Long Only'
// [*] '(ZIG) Leverage'         : '1' (Or no leverage)
// [/LIST]
// but you can change those settings if needed.


// [B]FIRST STEP[/B]
// [LIST]
// [*] For both future or spot markets you should make sure to change '(ZIG) Zignaly Alert Type' to match either WebHook or Email. If you have a non paid account in TradingView as in October 2020 you would have to use Email which it's free to use.
// [/LIST]

// [B]RECOMMENDED SETTINGS[/B]
// [B]__ RECOMMENDED SETTINGS - Spot markets[/B]
// [LIST]
// [*] '(ZIG) Exchange Type'   setting should be set to 'Spot'
// [*] '(STRAT) Strategy Type' setting should be set to 'Long Only'
// [*] '(ZIG) Leverage'        setting should be set to '1'
// [/LIST]
// [B]__ RECOMMENDED SETTINGS - Future markets[/B]
// [LIST]
// [*] '(ZIG) Exchange Type'   setting should be set to 'Futures'
// [*] '(STRAT) Strategy Type' setting should be set to 'Long and Short'
// [*] '(ZIG) Leverage'        setting might be changed if desired.
// [/LIST]
// [B]__ RECOMMENDED SETTINGS - Signal Providers[/B]
// [LIST]
// [*] '(ZIG) Provider type'   setting should be set to 'Signal Provider'
// [*] '(CAPITAL) Capital quote invested per order in USDT units' setting might be changed if desired.
// [/LIST]
// [B]__ RECOMMENDED SETTINGS - Copy Trader Providers[/B]
// [LIST]
// [*] '(ZIG) Provider type'   setting should be set to 'Copy Trader Provider'
// [*] '(CAPITAL) Capital percentage invested per order (%)' setting might be changed if desired.
// [*] Strategy Properties setting: 'Initial Capital' might be changed if desired.
// [/LIST]

// [B]INTEGRATION TYPE EXPLANATION[/B]
// [LIST]
// [*] 'Hybrid': Both TradingView and Zignaly handle take profit, trailing stops and stop losses. Useful if you are scared about TradingView not firing an alert. It might arise problems if TradingView and Zignaly get out of sync.
// [*] 'TradingView only': TradingView sends entry and exit orders to Zignaly so that Zignaly only buys or sells. Zignaly won't handle stop loss or other settings on its own.
// [/LIST]

// [B]HOW TO USE THIS STRATEGY[/B]
// [LIST]
// [*] Beginner: Copy and paste the strategy and change it to your needs. Turn off '(DEBUG) Enable debug on order comments' setting.
// [*] Medium: Reuse functions and inputs from this strategy into your own as if it was a library.
// [*] Advanced: Check Strategy Tester. List of trades. Copy and paste the different suggested 'alert_message' variable contents to your script and change them to your needs.
// [*] Expert: You needed a way to pass data from TradingView script to the alert. Now you know it's the 'alert_message' variable. You can find several examples in the source code using the variable. You also have seen 'ALERTS SETUP' explanation below. An additional quick look at 'Strategy Tester', 'List of Trades' and you are ready to go.
// [/LIST]


// [B] ALERTS SETUP[/B]
// This is the important piece of information that allows you to connect TradingView to Zignaly in a semi-automatic manner.
// [B] __ ALERTS SETUP - WebHook[/B]
// [LIST]
// [*] Webhook URL: https : // zignaly . com / api / signals.php?key=MYSECRETKEY
// [*] Message: { {{strategy.order.alert_message}} , "key" : "MYSECRETKEY" }
// [/LIST]
// [B] __ ALERTS SETUP - Email[/B]
// [LIST]
// [*] Setup a new Hotmail account
// [*] Add it as an 'SMS email' in TradingView Profile settings page.
// [*] Confirm your own the email address
// [*] Create a rule in your Hotmail account that 'Redirects' (not forwards) emails to 'signals @ zignaly . email' when (1): 'Subject' includes 'Alert', (2): 'Email body' contains string 'MYZIGNALYREDIRECTTRIGGER' and (3): 'From' contains 'noreply @ tradingview . com'.
// [*] In 'More Actions' check: Send Email-to-SMS
// [*] Message: ||{{strategy.order.alert_message}}||key=MYSECRETKEY||
// MYZIGNALYREDIRECTTRIGGER
// [/LIST]


// '(DEBUG) Enable debug on order comments' is turned on by default so that you can see in the Strategy Tester. List of Trades. The different orders alert_message that would have been sent to your alert. You might want to turn it off it some many letters in the screen is problem.

// [B]STRATEGY ADVICE[/B]
// [LIST]
// [*] If you turn on 'Take Profit' then turn off 'Trailing Take Profit'.
// [/LIST]
//
// [B]ZIGNALY SIDE ADVICE[/B]
// [LIST]
// [*] If you are a 'Signal Provider' make sure that 'Allow reusing the same signalId if there isn't any open position using it?' setting in the profile tab is set to true.
// [*] You can find your 'MYSECRETKEY' in your 'Copy Trader/Signal' provider Edit tab at 'Signal URL'.
// [/LIST]
//
// [B]ADDITIONAL ZIGNALY DOCUMENTATION[/B]
// This beginner's guide is quite basic and meant to be an introduction. Please read additional documentation to learn what you actually can do with Zignaly.
// [LIST]
// [*] docs . zignaly . com / signals / how-to -- How to send signals to Zignaly
// [*] 3 Ways to send signals to Zignaly
// [*] SIGNALS
// [/LIST]
//
// [B]FINAL REMARKS[/B]
// [LIST]
// [*] This strategy tries to match the Pine Script Coding Conventions as best as possible.
// [*] You can check my 'Ruckard TradingLatino' strategy for a more complex strategy that it's also integrated with Zignaly. Unfortunatley it does not use Pine Script Coding Conventions as much.
// [/LIST]

// Tradingview Public description - END

strategy("Zignaly Tutorial A061", shorttitle="A061ZigTuto", overlay=true, max_bars_back=5000, calc_on_order_fills=false, calc_on_every_tick=false, pyramiding=0, initial_capital=1000, slippage=1, commission_type=strategy.commission.percent, commission_value=0.1)

// INPUTS - BEGIN

// Strategy - Inputs
i_enableZignalyAlert = input(true, "(ZIG) Enable Alert message {True}")

_ZIGHYBRIDINTEGRATION_     = "Hybrid"                , _ZIGTVONLYINTEGRATION_  = "TradingView only"
i_zignalyIntegrationType    = input(_ZIGTVONLYINTEGRATION_,  "(ZIG) Integration type", options=[_ZIGTVONLYINTEGRATION_, _ZIGHYBRIDINTEGRATION_])
_ZIGSIGNALPROVIDER_     = "Signal Provider"                , _ZIGCOPYTRADERPROVIDER_  = "Copy Trader Provider"
i_zignalyProviderType    = input(_ZIGCOPYTRADERPROVIDER_,  "(ZIG) Provider type", options=[_ZIGSIGNALPROVIDER_, _ZIGCOPYTRADERPROVIDER_])
L_S     = "Long and Short"                , _L_  = "Long Only"                , _S_ = "Short Only"
i_strategyType    = input(_L_,  "(STRAT) Strategy Type", options=[L_S, _L_, _S_])
// Order comments based debug
i_enableOrderCommentDebug = input(true, title="(DEBUG) Enable debug on order comments {True}", type=input.bool)
i_enableTakeProfit      = input(false, "(STOPTAKE) Take Profit? {false}")
i_enableStopLoss      = input(true, "(STOPTAKE) Stop Loss? {True}")
i_enableTrailingTakeProfit = input(true, title="(TRAILING) Enable Trailing Take Profit (%) {True}", type=input.bool)
i_TakeProfit      = input(1.1, title="(STOPTAKE) Take Profit % {3.0}") / 100
i_StopLoss      = input(2.0, title="(STOPTAKE) Stop Loss % {2.0}", minval=0.01  ) / 100
// Trailing Take Profit - Inputs
i_trailingTakeProfitPercentageTrigger = input(1.2, "(TRAILING) Trailing Take Profit Trigger (%) {2.5}",minval=0,step=0.01,type=input.float) * 0.01
i_trailingTakeProfitPercentageOffset = input(25.0, "(TRAILING) Trailing Take Profit as a percentage of Trailing Take Profit Trigger (%) {25.0}",minval=0,step=0.01,type=input.float) * 0.01
// Zignaly - Email (zignalye)
_ZIGNALYE_="Email", _ZIGNALYW_="WebHook"
i_zignalyAlertType    = input(_ZIGNALYW_,  "(ZIG) Zignaly Alert Type {WebHook}", options=[_ZIGNALYW_, _ZIGNALYE_])
_ZIGEXBINANCE_     = "Binance"                , _ZIGEXKUCOIN_  = "Kucoin"
i_zignalyExchange   = input(_ZIGEXBINANCE_,  "(ZIG) Exchange", options=[_ZIGEXBINANCE_, _ZIGEXKUCOIN_])
_ZIGEXTYPESPOT_     = "spot"                , _ZIGEXFUTURES_  = "futures"
i_zignalyExchangeType   = input(_ZIGEXTYPESPOT_,  "(ZIG) Exchange Type {Spot}", options=[_ZIGEXTYPESPOT_, _ZIGEXFUTURES_])
i_zignalyLeverage = input(1, "(ZIG) Leverage {1}",minval=1,step=1,maxval=125,type=input.integer)
var i_zignalyLeverage_str = tostring(i_zignalyLeverage) // It needs to run only once
i_priceDecimalDigits = input(2, "Number of decimal digits for Prices {2}", minval=0, maxval=10, step=1)
// Decimal - Inputs
i_contractMaximumDecimalNumber = input(3, title="(DECIMAL) Maximum number of decimal for contracts {3}",minval=0)
i_tooRecentMinutesNumber = input(6, "(RECENT) Number of minutes to wait to open a new order after the previous one has been opened {6}", minval=1, maxval=100, step=1)
i_CapitalQuote      = input(100.0,  title="(CAPITAL) Capital quote invested per order in USDT units {100.0}")
i_CapitalPercentage = input(25.0,   title="(CAPITAL) Capital percentage invested per order (%) {25.0}",minval=0,step=0.01,type=input.float) * 0.01

// INPUTS - END


// Strategy - INIT - BEGIN

// Dynamic Trailing Take Profit - Variables

var int buyOrderOpenBarIndex = na
var int sellOrderOpenBarIndex = na

var float buyStopLoss = na
var float sellStopLoss = na
var float newBuyStopLoss = na
var float newSellStopLoss = na

// Handle to avoid two long and short orders being too next to each other
var bool _oldInsideABuyOrder = false
var bool oldInsideASellOrder = false
var bool insideABuyOrder = false
var bool insideASellOrder = false

_oldInsideABuyOrder := insideABuyOrder
oldInsideASellOrder := insideASellOrder

var int lastOrderOpenBarTime = na

// Handle recalculate after Stop Loss / Take Profit order
if (strategy.position_size == 0.0)
    insideABuyOrder := false
    insideASellOrder := false
else
    lastOrderOpenBarTime := time_close

// Zignaly
exchangeTickerID = syminfo.basecurrency + syminfo.currency
var string zignalySeparator = ","
var string zignalyQuote = "\""
var string zignalyEquals = "="
if ( i_zignalyAlertType == _ZIGNALYE_)
    zignalySeparator := "||"
    zignalyQuote := ""
    zignalyEquals := "="
else
    zignalySeparator := ","
    zignalyQuote := "\""
    zignalyEquals := ":"

zignalyCommonAlertMessage = zignalyQuote + "exchange" + zignalyQuote + zignalyEquals + zignalyQuote + i_zignalyExchange + zignalyQuote + zignalySeparator + zignalyQuote + "exchangeAccountType" + zignalyQuote + zignalyEquals + zignalyQuote + i_zignalyExchangeType + zignalyQuote + zignalySeparator + zignalyQuote + "pair" + zignalyQuote + zignalyEquals + zignalyQuote + "" + exchangeTickerID  + zignalyQuote + zignalySeparator + zignalyQuote + "leverage" + zignalyQuote + zignalyEquals + zignalyQuote + i_zignalyLeverage_str + zignalyQuote

var string tmpOrderComment = na
var string tmpOrderAlertMessage = na

var int i_tooRecentMinutesNumber_ms = i_tooRecentMinutesNumber * 60 * 1000 // Convert minutes into milliseconds only once

// Strategy - INIT - END

// FUNCTIONS - BEGIN

// Decimals - Functions
f_getContractMultiplier(_contractMaximumDecimalNumber) =>
    _contractMultiplier = 1
    if (_contractMaximumDecimalNumber == 0)
        _contractMultiplier // Return 1
    else
        for _counter = 1 to _contractMaximumDecimalNumber
            _contractMultiplier:= _contractMultiplier * 10
        _contractMultiplier

f_priceDecimalDigitsZeroString () =>
    // Dependencies: i_priceDecimalDigits (initialized in inputs).
    _zeroString = ""
    if not (i_priceDecimalDigits == 0)
        for _digit = 1 to i_priceDecimalDigits
            _zeroString := _zeroString + "0"
    _zeroString

// Zignalye - Functions - BEGIN
f_getZignalyLongAlertMessage(_entryQuantityContractsUSDT, _currentCapital) =>
    // Dependencies: i_enableStopLoss (initialized in inputs).
    // Dependencies: i_enableTakeProfit (initialized in inputs).
    // Dependencies: i_TakeProfit (initialized in inputs).
    // Dependencies: i_enableTrailingTakeProfit (initialized in inputs).
    // Dependencies: i_trailingTakeProfitPercentageOffset (initialized in inputs).
    // Dependencies: i_trailingTakeProfitPercentageTrigger (initialized in inputs).
    // Dependencies: i_zignalyIntegrationType (initialized in inputs).

    // Function Dependencies: f_priceDecimalDigitsZeroString()

    var string _zignaleStopLossCombo = ""
    var string _zignaleTakeProfitCombo = ""
    var string _zignaleTrailingTakeProfitCombo = ""
    _zignalyLongCommonAlertMessage = zignalyQuote + "type" + zignalyQuote + zignalyEquals + zignalyQuote + "entry" + zignalyQuote + zignalySeparator + zignalyQuote + "side" + zignalyQuote + zignalyEquals + zignalyQuote + "long" + zignalyQuote + zignalySeparator + zignalyQuote + "orderType" + zignalyQuote + zignalyEquals + zignalyQuote + "market" + zignalyQuote + zignalySeparator + zignalyQuote + "signalId" + zignalyQuote + zignalyEquals + zignalyQuote + "LONG-" + exchangeTickerID + zignalyQuote
    float _floatEntryQuantityContractsUSDT = _entryQuantityContractsUSDT
    _entryQuantityContractsUSDTStr = tostring(_entryQuantityContractsUSDT, "0." + f_priceDecimalDigitsZeroString())
    float _floatCurrentCapital = _currentCapital
    float _entryQuantityContractsPercent = (_floatEntryQuantityContractsUSDT / _floatCurrentCapital) * 100.00
    _entryQuantityContractsPercentStr = tostring(_entryQuantityContractsPercent, "0." + f_priceDecimalDigitsZeroString())

    // This is actually not needed because with pyramiding=0 it's impossible that an order is scaled (and thus modified)
    float _constantBuyStopLoss = na
    if (_oldInsideABuyOrder and insideABuyOrder)
        _constantBuyStopLoss := buyStopLoss
    else
        _constantBuyStopLoss := newBuyStopLoss

    if (i_enableStopLoss and (i_zignalyIntegrationType == _ZIGHYBRIDINTEGRATION_))
        _zignaleStopLossCombo := zignalySeparator + zignalyQuote + "stopLossPercentage" + zignalyQuote + zignalyEquals + zignalyQuote + "-" + tostring((nz(_constantBuyStopLoss) * 100), "0." + f_priceDecimalDigitsZeroString()) + zignalyQuote
    else
        _zignaleStopLossCombo := ""
    if (i_enableTakeProfit and (i_zignalyIntegrationType == _ZIGHYBRIDINTEGRATION_))
        _zignaleTakeProfitCombo := zignalySeparator + zignalyQuote + "takeProfitPercentage1" + zignalyQuote + zignalyEquals + zignalyQuote + "" + tostring((i_TakeProfit * 100), "0." + f_priceDecimalDigitsZeroString()) + zignalyQuote
    else
        _zignaleTakeProfitCombo := ""
    if (i_enableTrailingTakeProfit and (i_zignalyIntegrationType == _ZIGHYBRIDINTEGRATION_))
        _zignaleTrailingTakeProfitCombo := zignalySeparator + zignalyQuote + "trailingStopDistancePercentage" + zignalyQuote + zignalyEquals + zignalyQuote + "-" + tostring((i_trailingTakeProfitPercentageOffset * 100), "0." + f_priceDecimalDigitsZeroString()) + zignalyQuote + zignalySeparator + zignalyQuote + "trailingStopTriggerPercentage" + zignalyQuote + zignalyEquals + zignalyQuote + "" + tostring((i_trailingTakeProfitPercentageTrigger * 100), "0." + f_priceDecimalDigitsZeroString()) + zignalyQuote
    else
        _zignaleTrailingTakeProfitCombo := ""


    var string _message = ""
    if (i_zignalyProviderType == _ZIGCOPYTRADERPROVIDER_)
        _message :=
             zignalyCommonAlertMessage +
             zignalySeparator +
             _zignalyLongCommonAlertMessage +
             zignalySeparator +
             zignalyQuote + "positionSizePercentage" + zignalyQuote + zignalyEquals + zignalyQuote + "" +  _entryQuantityContractsPercentStr + zignalyQuote +
             _zignaleStopLossCombo +
             _zignaleTakeProfitCombo +
             _zignaleTrailingTakeProfitCombo
    else // _ZIGSIGNALPROVIDER_
        _message :=
             zignalyCommonAlertMessage +
             zignalySeparator +
             _zignalyLongCommonAlertMessage +
             zignalySeparator +
             zignalyQuote + "positionSizeQuote" + zignalyQuote + zignalyEquals + zignalyQuote + "" +  _entryQuantityContractsUSDTStr + zignalyQuote +
             _zignaleStopLossCombo +
             _zignaleTakeProfitCombo +
             _zignaleTrailingTakeProfitCombo

    _message

f_getZignalyLongCloseAlertMessage() =>
    // Dependencies: zignalyQuote
    // Dependencies: zignalyEquals
    // Dependencies: zignalySeparator
    // Dependencies: zignalyCommonAlertMessage

    _zignalyLongCloseCommonAlertMessage = zignalyQuote + "type" + zignalyQuote + zignalyEquals + zignalyQuote + "exit" + zignalyQuote + zignalySeparator + zignalyQuote + "side" + zignalyQuote + zignalyEquals + zignalyQuote + "long" + zignalyQuote + zignalySeparator + zignalyQuote + "orderType" + zignalyQuote + zignalyEquals + zignalyQuote + "market" + zignalyQuote + zignalySeparator + zignalyQuote + "signalId" + zignalyQuote + zignalyEquals + zignalyQuote + "LONG-" + exchangeTickerID + zignalyQuote

    var string _message = ""
    _message := zignalyCommonAlertMessage + zignalySeparator + _zignalyLongCloseCommonAlertMessage
    _message

f_getZignalyShortAlertMessage(_entryQuantityContractsUSDT, _currentCapital) =>
    // Dependencies: i_enableStopLoss (initialized in inputs).
    // Dependencies: i_enableTakeProfit (initialized in inputs).
    // Dependencies: i_TakeProfit (initialized in inputs).
    // Dependencies: i_enableTrailingTakeProfit (initialized in inputs).
    // Dependencies: i_trailingTakeProfitPercentageOffset (initialized in inputs).
    // Dependencies: i_trailingTakeProfitPercentageTrigger (initialized in inputs).
    // Dependencies: i_zignalyIntegrationType (initialized in inputs).

    // Function Dependencies: f_priceDecimalDigitsZeroString()

    var string _zignaleStopLossCombo = ""
    var string _zignaleTakeProfitCombo = ""
    var string _zignaleTrailingTakeProfitCombo = ""
    _zignalyLongCloseCommonAlertMessage = zignalyQuote + "type" + zignalyQuote + zignalyEquals + zignalyQuote + "entry" + zignalyQuote + zignalySeparator + zignalyQuote + "side" + zignalyQuote + zignalyEquals + zignalyQuote + "short" + zignalyQuote + zignalySeparator + zignalyQuote + "orderType" + zignalyQuote + zignalyEquals + zignalyQuote + "market" + zignalyQuote + zignalySeparator + zignalyQuote + "signalId" + zignalyQuote + zignalyEquals + zignalyQuote + "SHORT-" + exchangeTickerID + zignalyQuote
    float _floatEntryQuantityContractsUSDT = _entryQuantityContractsUSDT
    _entryQuantityContractsUSDTStr = tostring(_entryQuantityContractsUSDT, "0." + f_priceDecimalDigitsZeroString())
    float _floatCurrentCapital = _currentCapital
    float _entryQuantityContractsPercent = (_floatEntryQuantityContractsUSDT / _floatCurrentCapital) * 100.00
    _entryQuantityContractsPercentStr = tostring(_entryQuantityContractsPercent, "0." + f_priceDecimalDigitsZeroString())

    // This is actually not needed because with pyramiding=0 it's impossible that an order is scaled (and thus modified)
    float _constantSellStopLoss = na
    if (oldInsideASellOrder and insideASellOrder)
        _constantSellStopLoss := sellStopLoss
    else
        _constantSellStopLoss := newSellStopLoss

    if (i_enableStopLoss and (i_zignalyIntegrationType == _ZIGHYBRIDINTEGRATION_))
        _zignaleStopLossCombo := zignalySeparator + zignalyQuote + "stopLossPercentage" + zignalyQuote + zignalyEquals + zignalyQuote + "" + tostring((nz(_constantSellStopLoss) * 100), "0." + f_priceDecimalDigitsZeroString()) + zignalyQuote
    else
        _zignaleStopLossCombo := ""
    if (i_enableTakeProfit and (i_zignalyIntegrationType == _ZIGHYBRIDINTEGRATION_))
        _zignaleTakeProfitCombo := zignalySeparator + zignalyQuote + "takeProfitPercentage1" + zignalyQuote + zignalyEquals + zignalyQuote + "-" + tostring((i_TakeProfit * 100), "0." + f_priceDecimalDigitsZeroString()) + zignalyQuote
    else
        _zignaleTakeProfitCombo := ""
    if (i_enableTrailingTakeProfit and (i_zignalyIntegrationType == _ZIGHYBRIDINTEGRATION_))
        _zignaleTrailingTakeProfitCombo := zignalySeparator + zignalyQuote + "trailingStopDistancePercentage" + zignalyQuote + zignalyEquals + zignalyQuote + "" + tostring((i_trailingTakeProfitPercentageOffset * 100), "0." + f_priceDecimalDigitsZeroString()) + zignalyQuote + zignalySeparator + zignalyQuote + "trailingStopTriggerPercentage" + zignalyQuote + zignalyEquals + zignalyQuote + "-" + tostring((i_trailingTakeProfitPercentageTrigger * 100), "0." + f_priceDecimalDigitsZeroString()) + zignalyQuote
    else
        _zignaleTrailingTakeProfitCombo := ""


    var string _message = ""
    if (i_zignalyProviderType == _ZIGCOPYTRADERPROVIDER_)
        _message :=
             zignalyCommonAlertMessage +
             zignalySeparator +
             _zignalyLongCloseCommonAlertMessage +
             zignalySeparator +
             zignalyQuote + "positionSizePercentage" + zignalyQuote + zignalyEquals + zignalyQuote + "" +  _entryQuantityContractsPercentStr + zignalyQuote +
             _zignaleStopLossCombo +
             _zignaleTakeProfitCombo +
             _zignaleTrailingTakeProfitCombo
    else // _ZIGSIGNALPROVIDER_
        _message :=
             zignalyCommonAlertMessage +
             zignalySeparator +
             _zignalyLongCloseCommonAlertMessage +
             zignalySeparator +
             zignalyQuote + "positionSizeQuote" + zignalyQuote + zignalyEquals + zignalyQuote + "" +  _entryQuantityContractsUSDTStr + zignalyQuote +
             _zignaleStopLossCombo +
             _zignaleTakeProfitCombo +
             _zignaleTrailingTakeProfitCombo

    _message

f_getZignalyShortCloseAlertMessage() =>
    // Dependencies: zignalyQuote
    // Dependencies: zignalyEquals
    // Dependencies: zignalySeparator
    // Dependencies: zignalyCommonAlertMessage

    zignalyShortCloseCommonAlertMessage = zignalyQuote + "type" + zignalyQuote + zignalyEquals + zignalyQuote + "exit" + zignalyQuote + zignalySeparator + zignalyQuote + "side" + zignalyQuote + zignalyEquals + zignalyQuote + "short" + zignalyQuote + zignalySeparator + zignalyQuote + "orderType" + zignalyQuote + zignalyEquals + zignalyQuote + "market" + zignalyQuote + zignalySeparator + zignalyQuote + "signalId" + zignalyQuote + zignalyEquals + zignalyQuote + "SHORT-" + exchangeTickerID + zignalyQuote

    var string _message = ""
    _message := zignalyCommonAlertMessage + zignalySeparator + zignalyShortCloseCommonAlertMessage
    _message

// Zignalye - Functions - END

// Order comment - Functions - BEGIN

f_getOrderComment(_typeOrder, _side, _alertMessage) =>
    // Dependencies: i_enableOrderCommentDebug (initialized in inputs).

    // TODO: Add descriptive comments
    // _typeOrder="entry" or _typeOrder="close"
    // _side: true means long ; false means short ; We can use strategy.long or strategy.short as true and false aliases
    // _alertMessage
    var string _orderComment = ""

    if (i_enableOrderCommentDebug)
        _orderComment := _alertMessage
    else
        // TODO: Use human explanations instead of default order comment value (na)
        _orderComment := na

    _orderComment

// Order comment - Functions - END

// Too recent orders functions

f_getTooRecentOrderNotOpenAdvice () =>
    // Dependencies: i_tooRecentMinutesNumber_ms
    // Dependencies: lastOrderOpenBarTime

    // Condition 1: The order was open
    // Condition 2: The order was long or short
    // Condition 3: Time since order was last open is smaller than minimum between orders
    // Returns boolean
    bool _isTooRecent =  ((time_close) <= (lastOrderOpenBarTime + i_tooRecentMinutesNumber_ms))

    bool _tooRecentOrderBuyNotOpenAdvice = na
    if (na(lastOrderOpenBarTime))
        _tooRecentOrderBuyNotOpenAdvice := false
    else
        _tooRecentOrderBuyNotOpenAdvice := _isTooRecent
    _tooRecentOrderBuyNotOpenAdvice

// FUNCTIONS - END


// Strategy Body - BEGIN


// Simple Logic to go LONG/LONG or go SHORT/SHORT - BEGIN
// longCondition = crossover(sma(close, 14), sma(close, 28))
// shortCondition = crossunder(sma(close, 14), sma(close, 28))
longCondition = sma(close, 14) >= sma(close, 28)
shortCondition = sma(close, 14) < sma(close, 28)
// Simple Logic to go LONG/LONG or go SHORT/SHORT - END


// Position price calculation - BEGIN
float positionPrice = na
if (insideASellOrder or insideABuyOrder)
    positionPrice := strategy.position_avg_price
else
    positionPrice := close

// Position price calculation - END

tooRecentOrderNotOpenAdvice = f_getTooRecentOrderNotOpenAdvice ()

newBuyStopLoss := i_StopLoss
newSellStopLoss := i_StopLoss

// Decide if we are going to LONG/Go LONG - BEGIN
PRE_LONG = false
PRE_LONG := longCondition and (not tooRecentOrderNotOpenAdvice)

// LONG = PRE_LONG[1] and PRE_LONG // Wait for confirmation
LONG = PRE_LONG // Do not wait for confirmation

// Decide if we are going to LONG/Go LONG - END

// Decide if we are going to SHORT/Go SHORT - BEGIN
PRE_SHORT = false
PRE_SHORT := shortCondition and (not tooRecentOrderNotOpenAdvice)

// SHORT = PRE_SHORT[1] and PRE_SHORT // Wait for confirmation
SHORT = PRE_SHORT // Do not wait for confirmation

// Decide if we are going to SHORT/Go SHORT - END

// Decide if a LONG/LONG entry should be closed - BEGIN
LONG_CLOSE = true
LONG_CLOSE := not (longCondition)

// Let's make sure LONG does not trigger if LONG_CLOSE would tell us to close the LONG
if LONG_CLOSE
    LONG := false
// Decide if a LONG/LONG entry should be closed - END

// Decide if a SHORT/SHORT entry should be closed - BEGIN
SHORT_CLOSE = true
SHORT_CLOSE := not (shortCondition)

// Let's make sure SHORT does not trigger if SHORT_CLOSE would tell us to close the SHORT
if SHORT_CLOSE
    SHORT := false
// Decide if a SHORT/SHORT entry should be closed - END

// How much to LONG/GO LONG/SHORT/GO SHORT - BEGIN

// Custom take profit and stop loss
LongTakeProfit = positionPrice * (1 + i_TakeProfit)
ShortTakeProfit = positionPrice * (1 - i_TakeProfit)

float LongStopLoss = na
float ShortStopLoss = na

LongStopLoss := positionPrice * (1 - buyStopLoss)
ShortStopLoss := positionPrice * (1 + sellStopLoss)
strategy.initial_capital = 50000
float entryQuantity = na
float currentCapital = strategy.initial_capital + strategy.netprofit

if (i_zignalyProviderType == _ZIGCOPYTRADERPROVIDER_)
    entryQuantity := i_CapitalPercentage * currentCapital
else // _ZIGSIGNALPROVIDER_
    entryQuantity := i_CapitalQuote

float entryQuantityContractsReducer = 0.99

contractMultiplier = f_getContractMultiplier(i_contractMaximumDecimalNumber)

// We assume the current price is current bar close

entryQuantityContracts = (floor(((entryQuantity / close) * entryQuantityContractsReducer) * contractMultiplier) / contractMultiplier)
entryQuantityContractsUSDT = entryQuantityContracts * (close)

// How much to LONG/GO LONG/SHORT/GO SHORT - END


// GO LONG only logic - BEGIN

var float tmpPositionBeforeOpeningOrder = na

if (i_strategyType == _L_)
    if LONG
        tmpPositionBeforeOpeningOrder := strategy.position_avg_price
        tmpOrderAlertMessage := f_getZignalyLongAlertMessage(entryQuantityContractsUSDT, currentCapital)
        tmpOrderComment := f_getOrderComment("entry", strategy.long, tmpOrderAlertMessage)
        strategy.entry("[B]", strategy.long, qty=entryQuantityContracts, alert_message=i_enableZignalyAlert ? tmpOrderAlertMessage : na, comment=tmpOrderComment)
        if (na(tmpPositionBeforeOpeningOrder)) // bar_index should only be saved when there is no order opened
            buyOrderOpenBarIndex := bar_index + 1
        if (not insideABuyOrder)
            buyStopLoss := newBuyStopLoss
        insideABuyOrder := true
        0 // Workaround for making every if branch to return the same type of value
    else if LONG_CLOSE
        tmpOrderComment := f_getOrderComment("close", strategy.long, f_getZignalyLongCloseAlertMessage())
        strategy.close("[B]", alert_message=i_enableZignalyAlert ? f_getZignalyLongCloseAlertMessage() : na, comment=tmpOrderComment)
        insideABuyOrder := false
        0 // Workaround for making every if branch to return the same type of value
// GO LONG only logic - END

// GO SHORT only logic - BEGIN
if (i_strategyType == _S_)
    if SHORT
        tmpPositionBeforeOpeningOrder := strategy.position_avg_price
        tmpOrderAlertMessage := f_getZignalyShortAlertMessage(entryQuantityContractsUSDT, currentCapital)
        tmpOrderComment := f_getOrderComment("entry", strategy.short, tmpOrderAlertMessage)
        strategy.entry("[S]", strategy.short, qty=entryQuantityContracts, alert_message=i_enableZignalyAlert ? tmpOrderAlertMessage : na, comment=tmpOrderComment)
        if (na(tmpPositionBeforeOpeningOrder)) // bar_index should only be saved when there is no order opened
            sellOrderOpenBarIndex := bar_index + 1
        if (not insideASellOrder)
            sellStopLoss := newSellStopLoss
        insideASellOrder := true
        0 // Workaround for making every if branch to return the same type of value
    else if SHORT_CLOSE
        tmpOrderComment := f_getOrderComment("close", strategy.short, f_getZignalyShortCloseAlertMessage())
        strategy.close("[S]", alert_message=i_enableZignalyAlert ? f_getZignalyShortCloseAlertMessage() : na, comment=tmpOrderComment)
        insideASellOrder := false
        0 // Workaround for making every if branch to return the same type of value
// GO SHORT only logic - END

// GO LONG and SHORT logic - BEGIN
if (i_strategyType == L_S)
// Asumption: Above we have:
// if LONG_CLOSE
//    LONG := false
// if SHORT_CLOSE
//    SHORT := false

    // LONG and SHORT cannot be true at the same time
    // Anyways we will take it into account
    if (LONG == true) and (SHORT == true)
        LONG := true
        SHORT := false
        SHORT_CLOSE := true

    if LONG
        tmpPositionBeforeOpeningOrder := strategy.position_avg_price
        tmpOrderAlertMessage := f_getZignalyLongAlertMessage(entryQuantityContractsUSDT, currentCapital)
        tmpOrderComment := f_getOrderComment("entry", strategy.long, tmpOrderAlertMessage)
        strategy.entry("[B]", strategy.long, qty=entryQuantityContracts, alert_message=i_enableZignalyAlert ? tmpOrderAlertMessage : na, comment=tmpOrderComment)
        if (na(tmpPositionBeforeOpeningOrder)) // bar_index should only be saved when there is no order opened
            buyOrderOpenBarIndex := bar_index + 1
        if (not insideABuyOrder)
            buyStopLoss := newBuyStopLoss
        insideABuyOrder := true
    if LONG_CLOSE
        tmpOrderComment := f_getOrderComment("close", strategy.long, f_getZignalyLongCloseAlertMessage())
        strategy.close("[B]", alert_message=i_enableZignalyAlert ? f_getZignalyLongCloseAlertMessage() : na, comment=tmpOrderComment)
        insideABuyOrder := false
    if SHORT
        tmpPositionBeforeOpeningOrder := strategy.position_avg_price
        tmpOrderAlertMessage := f_getZignalyShortAlertMessage(entryQuantityContractsUSDT, currentCapital)
        tmpOrderComment := f_getOrderComment("entry", strategy.short, tmpOrderAlertMessage)
        strategy.entry("[S]", strategy.short, qty=entryQuantityContracts, alert_message=i_enableZignalyAlert ? tmpOrderAlertMessage : na, comment=tmpOrderComment)
        if (na(tmpPositionBeforeOpeningOrder)) // bar_index should only be saved when there is no order opened
            sellOrderOpenBarIndex := bar_index + 1
        if (not insideASellOrder)
            sellStopLoss := newSellStopLoss
        insideASellOrder := true
    if SHORT_CLOSE
        tmpOrderComment := f_getOrderComment("close", strategy.short, f_getZignalyShortCloseAlertMessage())
        strategy.close("[S]", alert_message=i_enableZignalyAlert ? f_getZignalyShortCloseAlertMessage() : na, comment=tmpOrderComment)
        insideASellOrder := false
// GO LONG and SHORT logic - END

// Handle STOP LOSS (and similar) order exits - BEGIN

// Quick Paste - BEGIN
float longTrailingTakeProfitPrice = na
float longTrailingTakeProfitPoints = na
float longTrailingTakeProfitOffset = na
float shortTrailingTakeProfitPrice = na
float shortTrailingTakeProfitPoints = na
float shortTrailingTakeProfitOffset = na

// Calculate trailing_take_profit_offset based on tick units
longTmpTtpBaseValue = positionPrice * (1 + i_trailingTakeProfitPercentageTrigger)
longTmpTtpTop_value = longTmpTtpBaseValue * (1 + i_trailingTakeProfitPercentageOffset)
longTrailingTakeProfitOffsetFloat = longTmpTtpTop_value - longTmpTtpBaseValue
float longTrailingTakeProfitOffsetTick = floor (longTrailingTakeProfitOffsetFloat / syminfo.mintick)

shortTmpTtpBaseValue = positionPrice * (1 - i_trailingTakeProfitPercentageTrigger)
shortTmpTtpBottomValue = shortTmpTtpBaseValue * (1 - i_trailingTakeProfitPercentageOffset)
shortTrailingTakeProfitOffsetFloat = shortTmpTtpBaseValue - shortTmpTtpBottomValue
float shortTrailingTakeProfitOffsetTick = floor (shortTrailingTakeProfitOffsetFloat / syminfo.mintick)

if i_enableTrailingTakeProfit
    longTrailingTakeProfitPrice := positionPrice * (1 + i_trailingTakeProfitPercentageTrigger)
    longTrailingTakeProfitOffset := longTrailingTakeProfitOffsetTick
    shortTrailingTakeProfitPrice := positionPrice * (1 - i_trailingTakeProfitPercentageTrigger)
    shortTrailingTakeProfitOffset := shortTrailingTakeProfitOffsetTick
else
    longTrailingTakeProfitPrice := na
    longTrailingTakeProfitOffset := na
    shortTrailingTakeProfitPrice := na
    shortTrailingTakeProfitOffset := na
// Quick Paste - END

// This might trigger additional close orders than needed in zignaly
// Better close an existing order twice than regreting zignaly not having closed it.

tmpOrderComment := f_getOrderComment("close", strategy.long, f_getZignalyLongCloseAlertMessage())
strategy.exit("[SL/TP]", "[B]", stop= i_enableStopLoss ? LongStopLoss : na, limit= i_enableTakeProfit ? LongTakeProfit : na, trail_price= i_enableTrailingTakeProfit ? longTrailingTakeProfitPrice : na, trail_offset = i_enableTrailingTakeProfit ? longTrailingTakeProfitOffset : na, alert_message= i_enableZignalyAlert ? f_getZignalyLongCloseAlertMessage() : na, comment=tmpOrderComment)
tmpOrderComment := f_getOrderComment("close", strategy.short, f_getZignalyShortCloseAlertMessage())
strategy.exit("[SL/TP]", "[S]", stop= i_enableStopLoss ? ShortStopLoss : na, limit= i_enableTakeProfit ? ShortTakeProfit : na, trail_price= i_enableTrailingTakeProfit ? shortTrailingTakeProfitPrice : na, trail_offset = i_enableTrailingTakeProfit ? shortTrailingTakeProfitOffset : na, alert_message= i_enableZignalyAlert ? f_getZignalyShortCloseAlertMessage() : na, comment=tmpOrderComment)

// Handle STOP LOSS (and similar) order exits - END

// Strategy Body - END