概述
该策略将布林带和移动平均线组合使用,通过布林带上轨和下轨来判断价格突破,利用快速移动平均线和慢速移动平均线的黄金交叉和死亡交叉来判断趋势,在布林带上轨突破且快速移动平均线上穿慢速移动平均线时做多,在布林带下轨突破且快速移动平均线下穿慢速移动平均线时做空,使用该双重条件判断可以有效过滤假突破。
策略原理
该策略主要使用布林带判断价位和移动平均线判断趋势两种技术指标进行组合。
布林带中带是价格的简单移动平均线,上轨是中带+2倍标准差,下轨是中带-2倍标准差。当价格接近上轨时代表着超买状况,当价格接近下轨时代表着超卖状况。
快速移动平均线是价格的50周期简单移动平均线,慢速移动平均线是价格的200周期简单移动平均线。当快速移动平均线上穿慢速移动平均线时代表着市场趋势转为上涨,即黄金交叉;当快速移动平均线下穿慢速移动平均线则代表着市场趋势转为下跌,即死亡交叉。
该策略判断入场时需要同时满足两个条件:价格突破布林带上轨表示突破阻力位 AND 快速移动平均线上穿慢速移动平均线表示趋势上涨;价格突破布林带下轨表示突破支撑位 AND 快速移动平均线下穿慢速移动平均线表示趋势下跌。这样可以有效过滤假突破对入场造成的影响。
策略优势
使用双重条件判断,可以有效过滤假突破,使入场更加准确。
布林带判断支撑阻力更加直观,移动平均线判断趋势更加可靠,组合使用可以互补。
参数优化空间大,可以通过调整布林带长度、标准差倍数、移动平均线周期等参数进行优化,适应更多市场环境。
实现简单,容易理解,代码量小,可直接用于实盘。
策略风险
布林带和移动平均线都可能出现失效的情况,双重条件判断也可能同时失效,从而造成错误入场。
移动平均线存在滞后问题,可能导致入场时机不准或者错过机会。
参数设置不当也会影响策略表现,如布林带周期过短、移动平均线周期不匹配等。
突破型策略容易受到假突破的影响,即使双重条件也无法完全规避假突破。
可以通过动态调整参数、严格止损、与其他指标组合等方法来减少策略风险。
策略优化方向
可以引入其他技术指标判断,如成交量放大突破布林带,MACD判断趋势等,形成多重条件判断。
可以结合K线形态来辅助判断入场时机,如收盘价触及布林带上轨时形成锤头等。
可以设置动态移动平均线来代替静态移动平均线,进一步优化判断趋势能力。
可以设置参数自动优化功能,通过历史回测来自动寻找最优参数组合。
可以调整持仓点位和止损点位,设置较严格止损来控制亏损。
总结
该策略基于布林带和移动平均线的技术指标进行组合运用,同时满足价格突破布林带上轨或下轨和快速移动平均线黄金交叉或死亡交叉的双重条件时才会入场。这样既利用了布林带判断支撑阻力的直观性,也利用了移动平均线判断趋势的可靠性,互为补充,可以有效过滤假突破对入场的影响。总体来说,该策略实用性强,易于实现,值得在实盘中应用与优化。
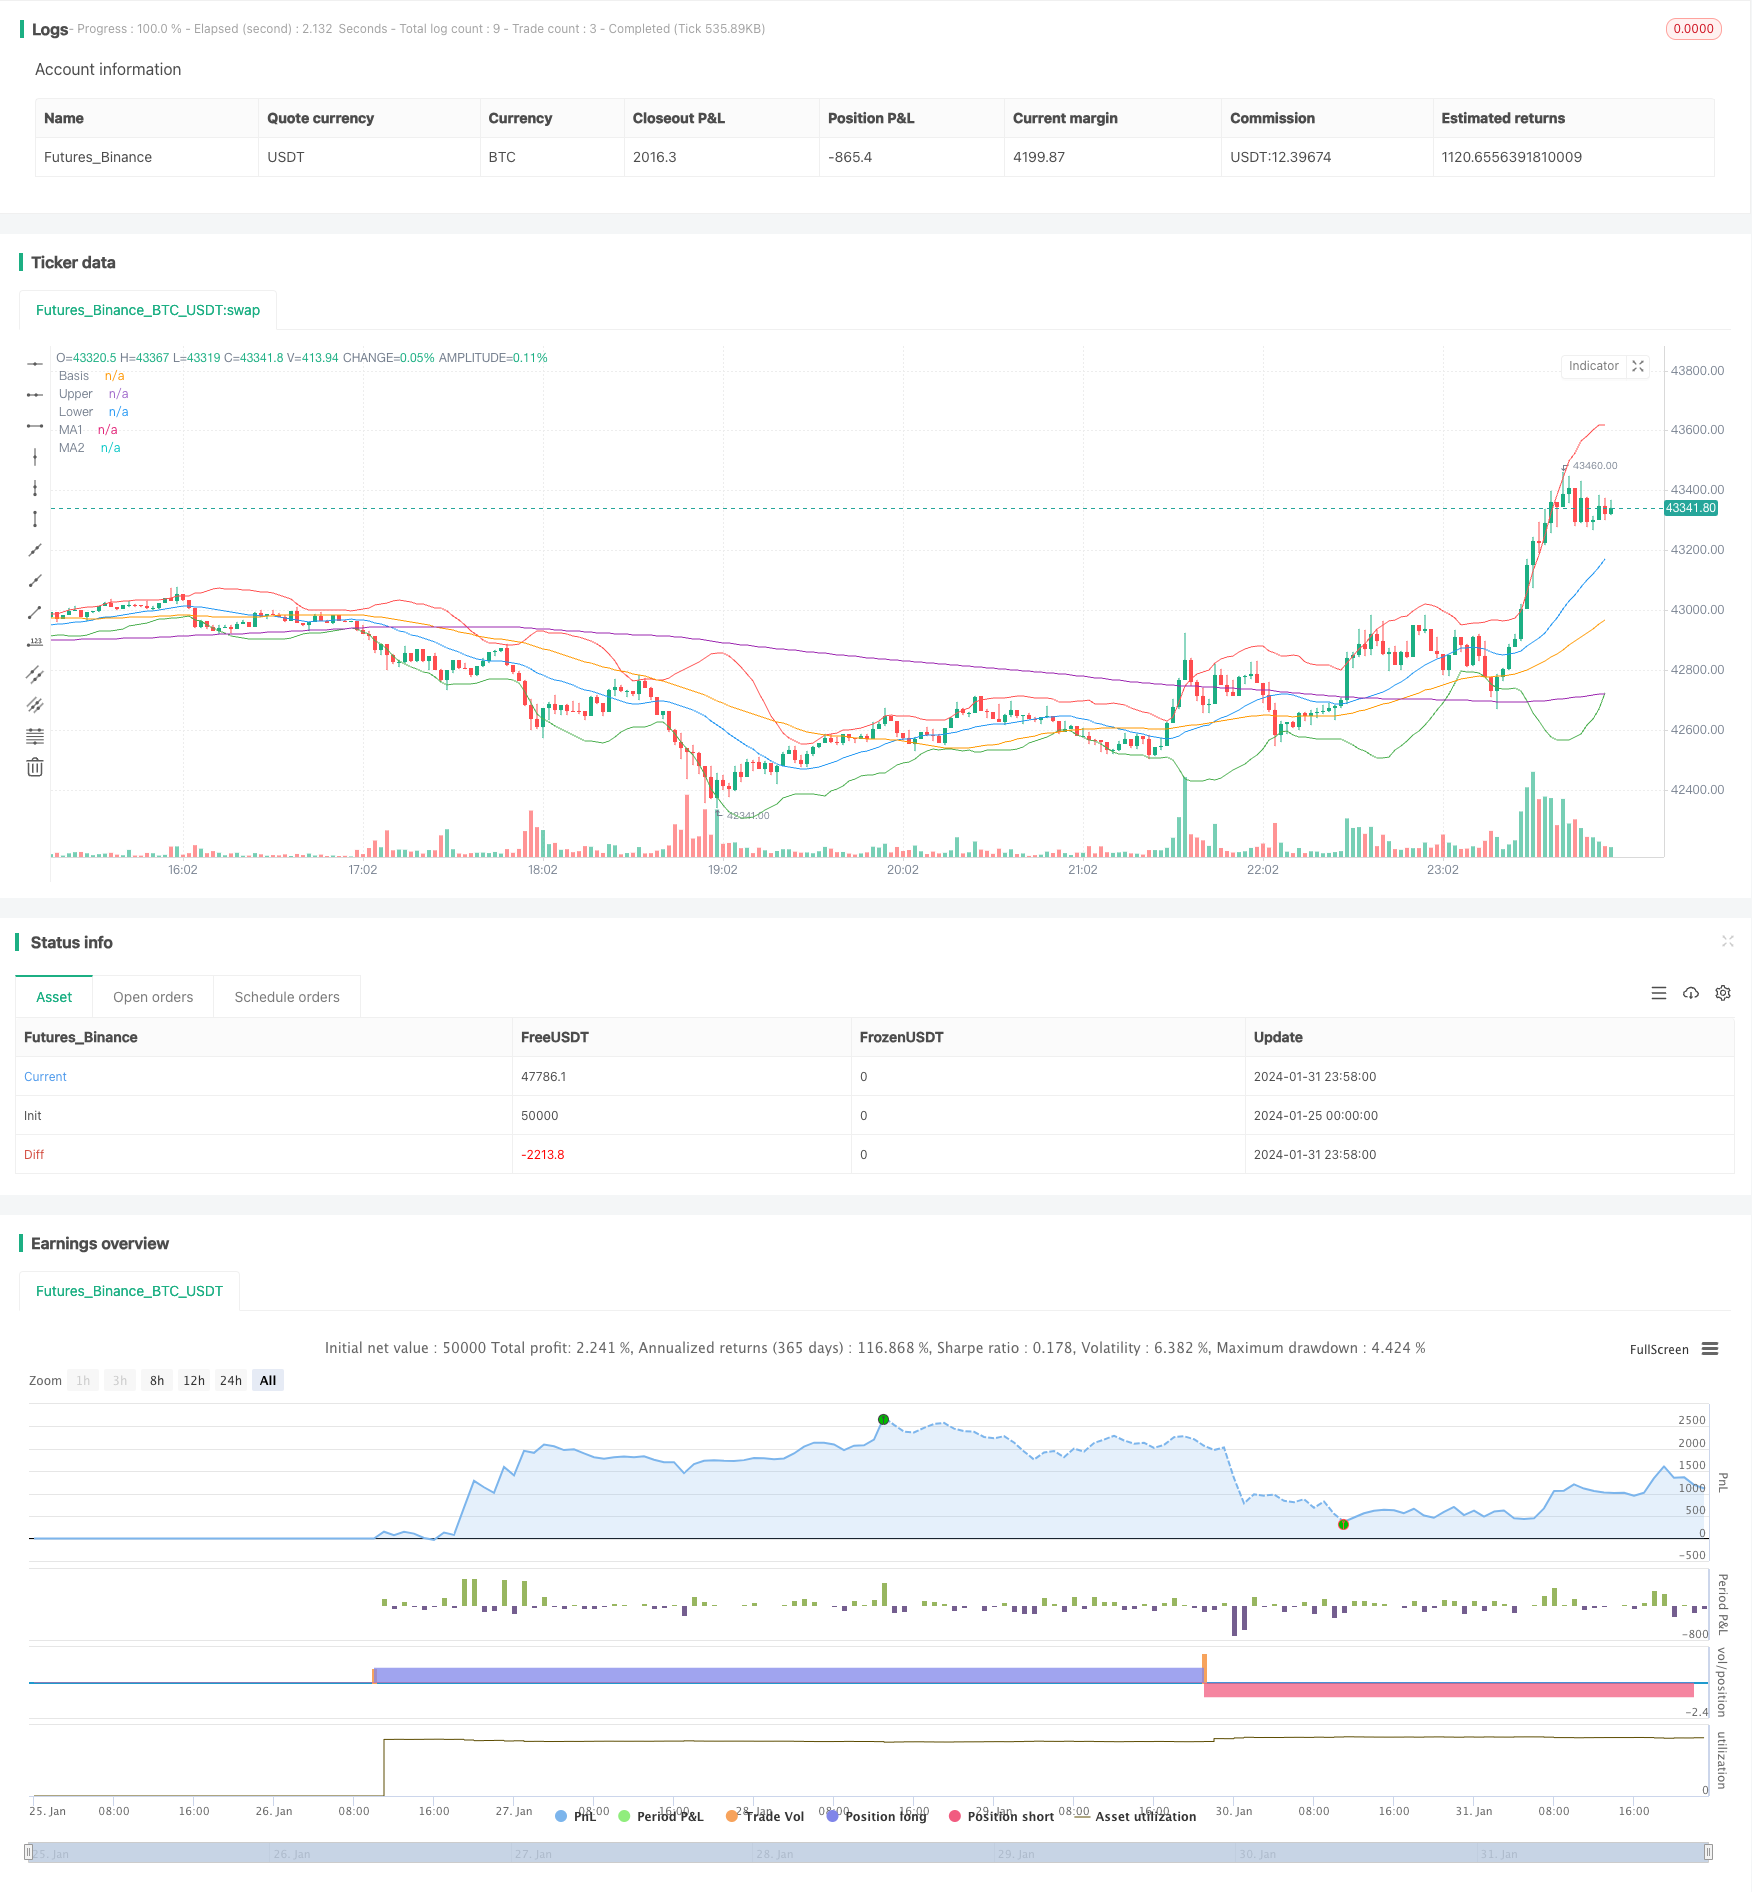
/*backtest
start: 2024-01-25 00:00:00
end: 2024-02-01 00:00:00
period: 2m
basePeriod: 1m
exchanges: [{"eid":"Futures_Binance","currency":"BTC_USDT"}]
*/

//@version=4
strategy("Bollinger Bands and Moving Averages Strategy", overlay=true)

// Bollinger Bands
length = input(20, minval=1, title="BB Length")
mult = input(2.0, minval=0.1, maxval=5, title="BB Standard Deviation")
src = close
basis = sma(src, length)
dev = mult * stdev(src, length)
upper = basis + dev
lower = basis - dev

// Moving Averages
ma1_length = input(50, minval=1, title="MA1 Length")
ma2_length = input(200, minval=1, title="MA2 Length")
ma1 = sma(src, ma1_length)
ma2 = sma(src, ma2_length)

// Strategy Conditions
longCondition = crossover(src, upper) and crossover(ma1, ma2)
shortCondition = crossunder(src, lower) and crossunder(ma1, ma2)

// Strategy Execution
strategy.entry("Long", strategy.long, when=longCondition)
strategy.entry("Short", strategy.short, when=shortCondition)
strategy.close("Long", when=shortCondition)
strategy.close("Short", when=longCondition)

// Plotting
plot(basis, color=color.blue, title="Basis")
plot(upper, color=color.red, title="Upper")
plot(lower, color=color.green, title="Lower")
plot(ma1, color=color.orange, title="MA1")
plot(ma2, color=color.purple, title="MA2")