概述
本策略综合运用一云延伸,移动平均聚散指标(MACD)和趋向指标(DMI)在多个时间框架上的信号,识别潜在的买入和卖出机会。它旨在为那些希望从短期和中期两个维度来审视市场的交易者提供参考。
策略原理
该策略基于15分钟(M15)和1小时(H1)图表上的一致信号来执行买入和卖出条件,同时参考4小时(H4)时间框架作为额外的确认。
买入条件
- M15、H1和H4时间框架上的价格高于一云延伸
- H1图表上MACD线高于信号线,且两条线都高于0
- H1图表上DI+线高于DI-线,ADX至少为25
- M15图表上的MACD线高于0,DI+线高于DI-线,ADX也至少为25
卖出条件
- M15、H1和H4时间框架上的价格低于一云延伸
- H1图表上MACD线低于信号线,且两条线都低0
- H1图表上DI-线高于DI+线,ADX至少为25
- M15图表上的MACD线低于0,DI-线高于DI+线,ADX也至少为25
入场和退出
- 当所有买入条件满足时,建立多头仓位,表明出现跨时间框架的上涨势头
- 当所有卖出条件满足时,建立空头仓位,表明出现跨时间框架的下跌势头
- 当相反条件满足时平仓,表明潜在反转或势头丧失
策略优势
- 考虑多时间框架,提高决策的准确性
- 一云延伸判断趋势方向和力度
- MACD判断短期和中期动量
- DMI判断买卖力道及趋势活跃度
- 组合多个指标,综合判断市场走向
- 可调整参数自定义买卖条件
- 可广泛应用于具明确趋势的市场
策略风险
- 多时间框架判断可能出现分歧,导致错误信号
- 一云延伸若使用不当可能产生误导
- MACD和DMI均有滞后性,可能错过转折点
- 需要同时监控多个时间框架指标
- 需谨慎处理突发事件带来的巨大价格变动
策略优化方向
- 优化一云延伸、MACD和DMI的参数组合
- 测试更多时间框架的结合,如日线等
- 增加其他指标的确认,如波动率、移动平均线等
- 参考更多历史数据优化买卖条件
- 结合机器学习等方法动态优化参数
总结
本策略充分利用多时间框架分析和多个指标的优势,可有效识别趋势的方向和力度。通过参数调整可适用于不同品种,也可针对特定行情进行优化。但交易者仍须谨记指标本身的局限并采取适当的风险控制措施,整体而言该策略为判断市场提供了一个相对全面的框架。
策略源码
/*backtest
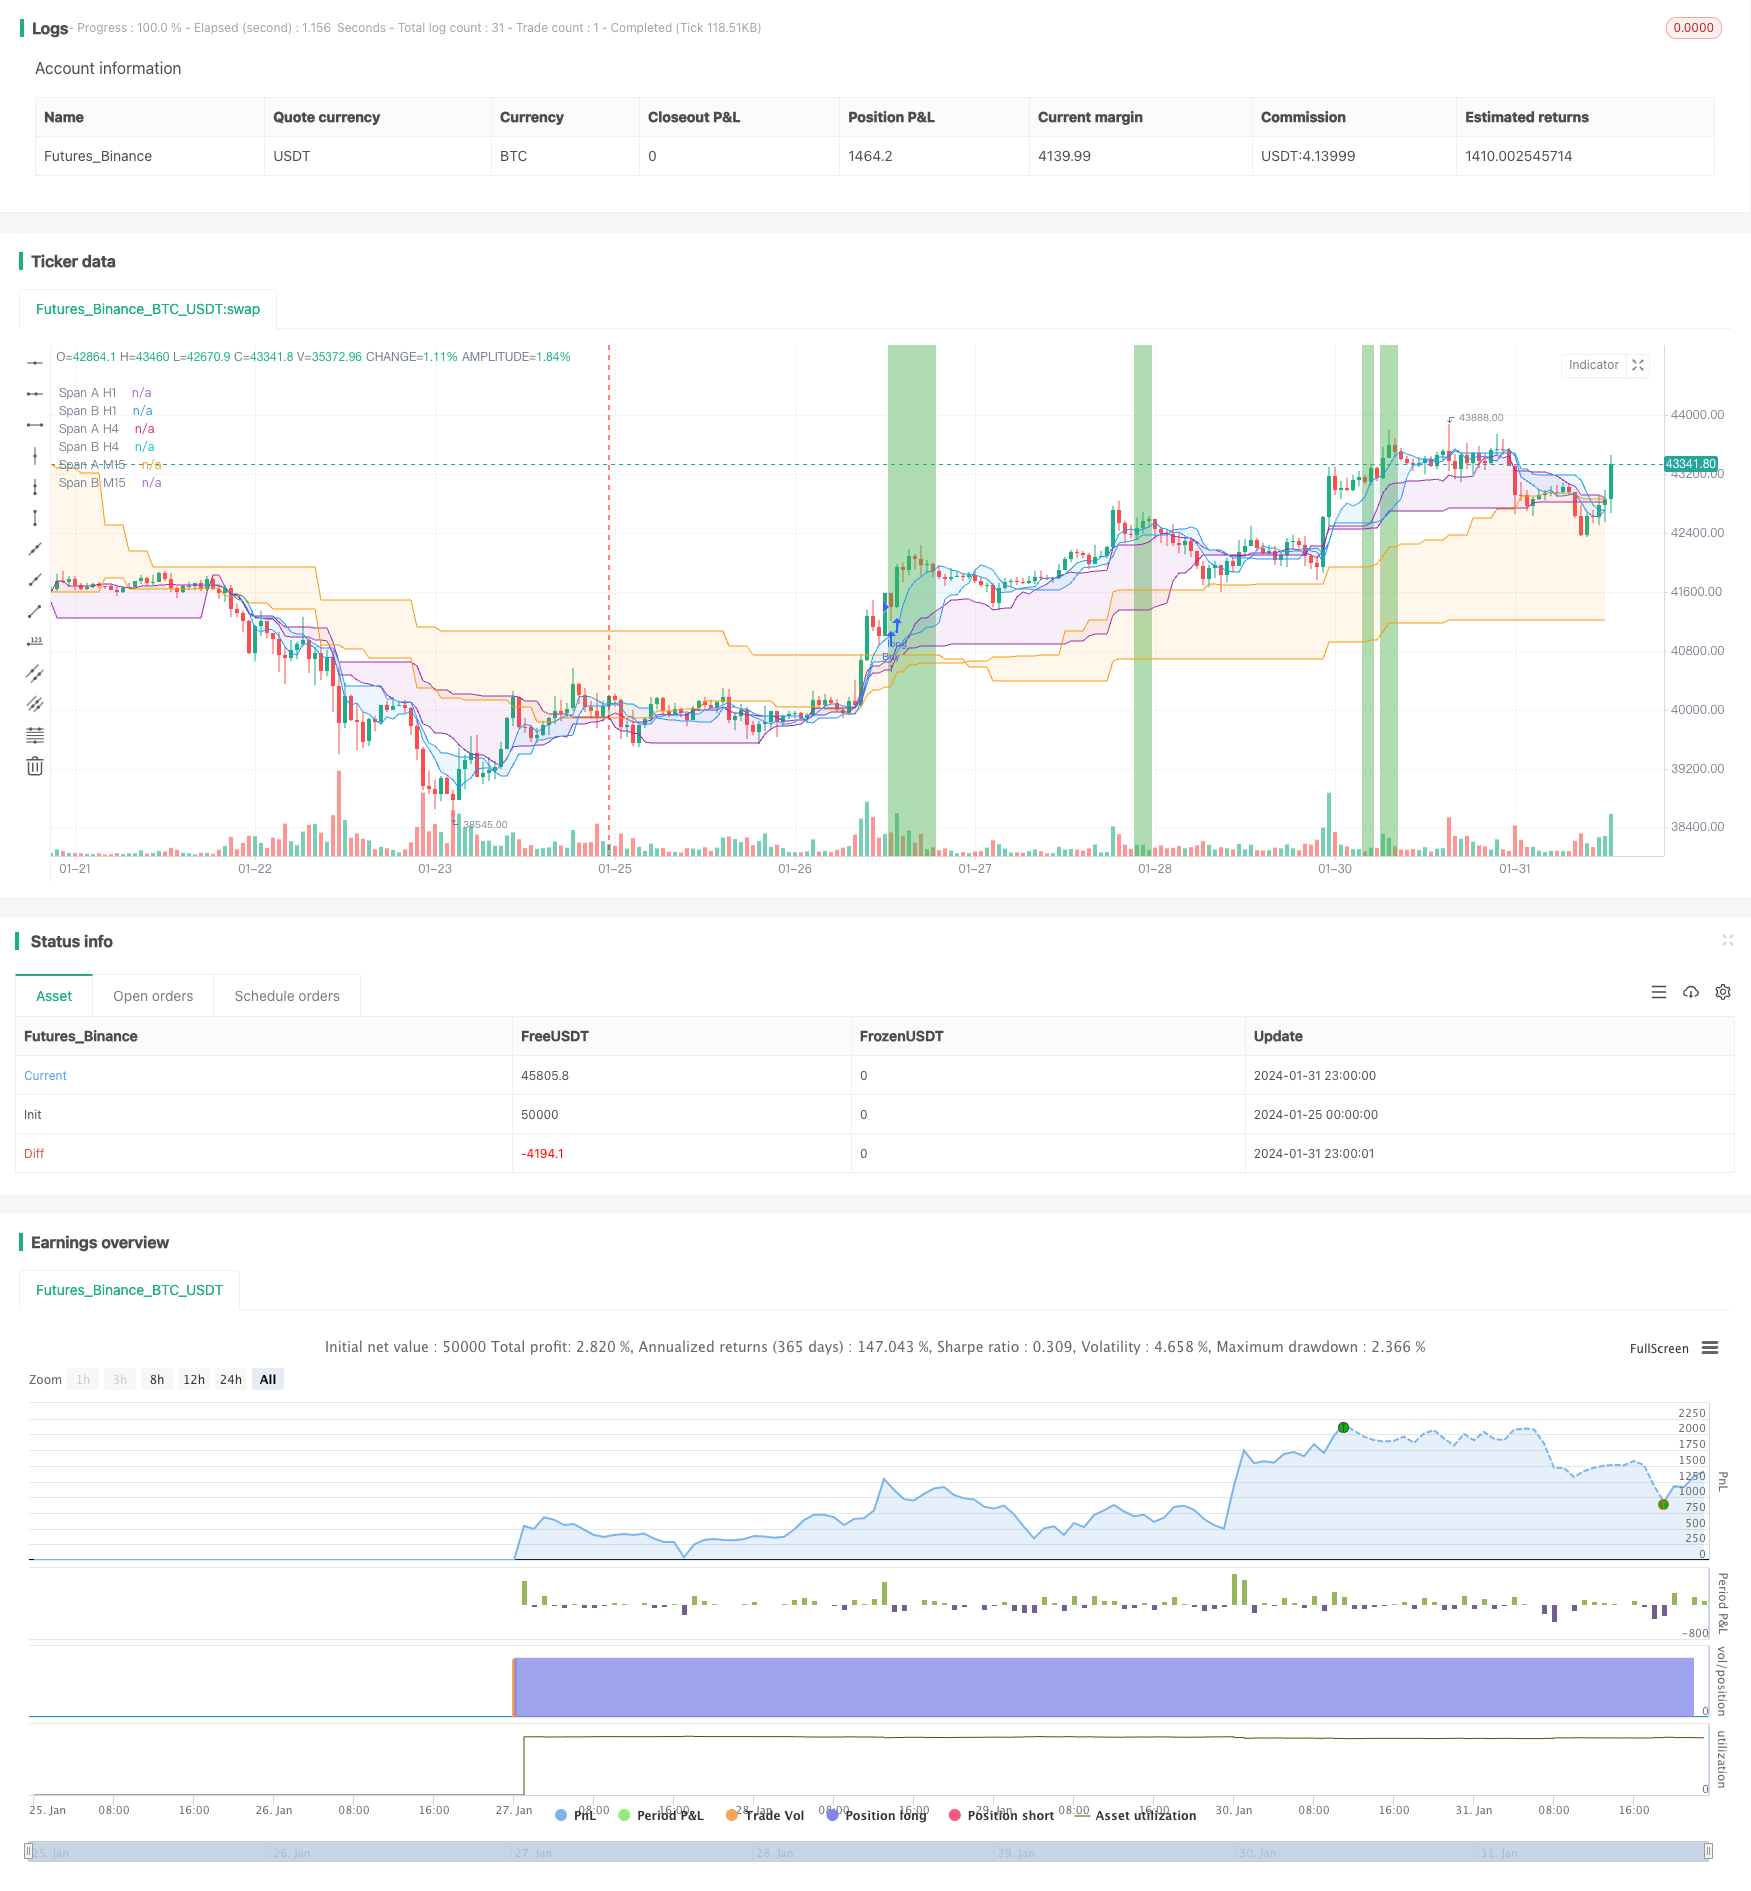
start: 2024-01-25 00:00:00
end: 2024-02-01 00:00:00
period: 1h
basePeriod: 15m
exchanges: [{"eid":"Futures_Binance","currency":"BTC_USDT"}]
*/
// This Pine Script™ code is subject to the terms of the Mozilla Public License 2.0 at https://mozilla.org/MPL/2.0/
// © haidinh83
//@version=5
strategy("Ichimoku, MACD, DMI Multiple time frame 21/01/2024", overlay=true)
// Khung thời gian
timeframe1 = "5" // M5
timeframe2 = "15" // M15
timeframe3 = "60" // H1
timeframe4 = "240" // H4
// Nhập tham số ADX và DI
lengthDMI = input(14, title="DMI Length")
thresholdADX = input(20, title="ADX Threshold")
// Tính giá trị Ichimoku
ichimoku(tenkanPeriod, kijunPeriod, senkouPeriod) =>
tenkanSen = (ta.highest(high, tenkanPeriod) + ta.lowest(low, tenkanPeriod)) / 2
kijunSen = (ta.highest(high, kijunPeriod) + ta.lowest(low, kijunPeriod)) / 2
senkouSpanA = (tenkanSen + kijunSen) / 2
senkouSpanB = (ta.highest(high, senkouPeriod) + ta.lowest(low, senkouPeriod)) / 2
[tenkanSen, kijunSen, senkouSpanA, senkouSpanB]
// Lấy Ichimoku từng khung thời gian
[tenkanM5, kijunM5, spanAM5, spanBM5] = request.security(syminfo.tickerid, timeframe1, ichimoku(9, 26, 52))
[tenkanM15, kijunM15, spanAM15, spanBM15] = request.security(syminfo.tickerid, timeframe2, ichimoku(9, 26, 52))
[tenkanH1, kijunH1, spanAH1, spanBH1] = request.security(syminfo.tickerid, timeframe3, ichimoku(9, 26, 52))
[tenkanH4, kijunH4, spanAH4, spanBH4] = request.security(syminfo.tickerid, timeframe4, ichimoku(9, 26, 52))
// Tính giá trị MACD và Signal Line cho từng khung thời gian
[macdM5, signalM5, _] = request.security(syminfo.tickerid, timeframe1, ta.macd(close, 12, 26, 9))
[macdM15, signalM15, _] = request.security(syminfo.tickerid, timeframe2, ta.macd(close, 12, 26, 9))
[macdH1, signalH1, _] = request.security(syminfo.tickerid, timeframe3, ta.macd(close, 12, 26, 9))
[macdH4, signalH4, _] = request.security(syminfo.tickerid, timeframe4, ta.macd(close, 12, 26, 9))
// Tính giá trị DMI cho từng khung thời gian
calcDMI(len) =>
up = ta.change(high)
down = -ta.change(low)
plusDM = na(up) ? na : (up > down and up > 0 ? up : 0)
minusDM = na(down) ? na : (down > up and down > 0 ? down : 0)
trur = ta.rma(ta.tr, len)
plus = fixnan(100 * ta.rma(plusDM, len) / trur)
minus = fixnan(100 * ta.rma(minusDM, len) / trur)
adx = 100 * ta.rma(math.abs(plus - minus) / (plus + minus == 0 ? 1 : plus + minus), len)
[plus, minus, adx] // Đảm bảo mỗi phần của hàm nằm trên một dòng riêng biệt
[plusM5, minusM5, adxM5] = request.security(syminfo.tickerid, timeframe1, calcDMI(lengthDMI))
[plusM15, minusM15, adxM15] = request.security(syminfo.tickerid, timeframe2, calcDMI(lengthDMI))
[plusH1, minusH1, adxH1] = request.security(syminfo.tickerid, timeframe3, calcDMI(lengthDMI))
[plusH4, minusH4, adxH4] = request.security(syminfo.tickerid, timeframe4, calcDMI(lengthDMI))
// Điều kiện mua cho H1
buyConditionH1 = (close > spanAM15) and (close > spanAH1) and (close > spanAH4) and
(macdH1 > signalH1) and (macdH1 > 0) and (signalH1 > 0) and
(plusH1 > minusH1) and (adxH1 >= 25)
// Điều kiện mua cho M15
buyConditionM15 = (close > spanAM15) and (close > spanAH1) and (close > spanAH4) and
(macdM15 > 0) and (plusM15 > minusM15) and (adxM15 >= 25)
// Điều kiện mua tổng hợp
buyCondition = buyConditionH1 and buyConditionM15
// Điều kiện bán cho H1
sellConditionH1 = (close < spanAM15) and (close < spanAH1) and (close < spanAH4) and
(macdH1 < signalH1) and (macdH1 < 0) and (signalH1 < 0) and
(minusH1 > plusH1) and (adxH1 >= 25)
// Điều kiện bán cho M15
sellConditionM15 = (close < spanAM15) and (close < spanAH1) and (close < spanAH4) and
(macdM15 < 0) and (minusM15 > plusM15) and (adxM15 >= 25)
// Điều kiện bán tổng hợp
sellCondition = sellConditionH1 and sellConditionM15
// Thực hiện giao dịch nếu điều kiện bán hoặc mua được đáp ứng
if buyCondition
strategy.entry("Buy", strategy.long)
if sellCondition
strategy.entry("Sell", strategy.short)
// Vẽ và tô màu giữa Senkou Span A và B cho mỗi khung thời gian
p1 = plot(spanAM15, color=color.blue, title="Span A M15")
p2 = plot(spanBM15, color=color.blue, title="Span B M15")
fill(p1, p2, color=color.new(color.blue, 90), title="M15 Cloud")
p3 = plot(spanAH1, color=color.purple, title="Span A H1")
p4 = plot(spanBH1, color=color.purple, title="Span B H1")
fill(p3, p4, color=color.new(color.purple, 90), title="H1 Cloud")
p5 = plot(spanAH4, color=color.orange, title="Span A H4")
p6 = plot(spanBH4, color=color.orange, title="Span B H4")
fill(p5, p6, color=color.new(color.orange, 90), title="H4 Cloud")
// Tô màu nền và hiển thị cảnh báo
bgcolor(buyCondition ? color.new(color.green, 45) : sellCondition ? color.new(color.red, 45) : na)
alertcondition(buyCondition, title="Mua Signal", message="Điều kiện mua đã được đáp ứng")
alertcondition(sellCondition, title="Bán Signal", message="Điều kiện bán đã được đáp ứng")