概述
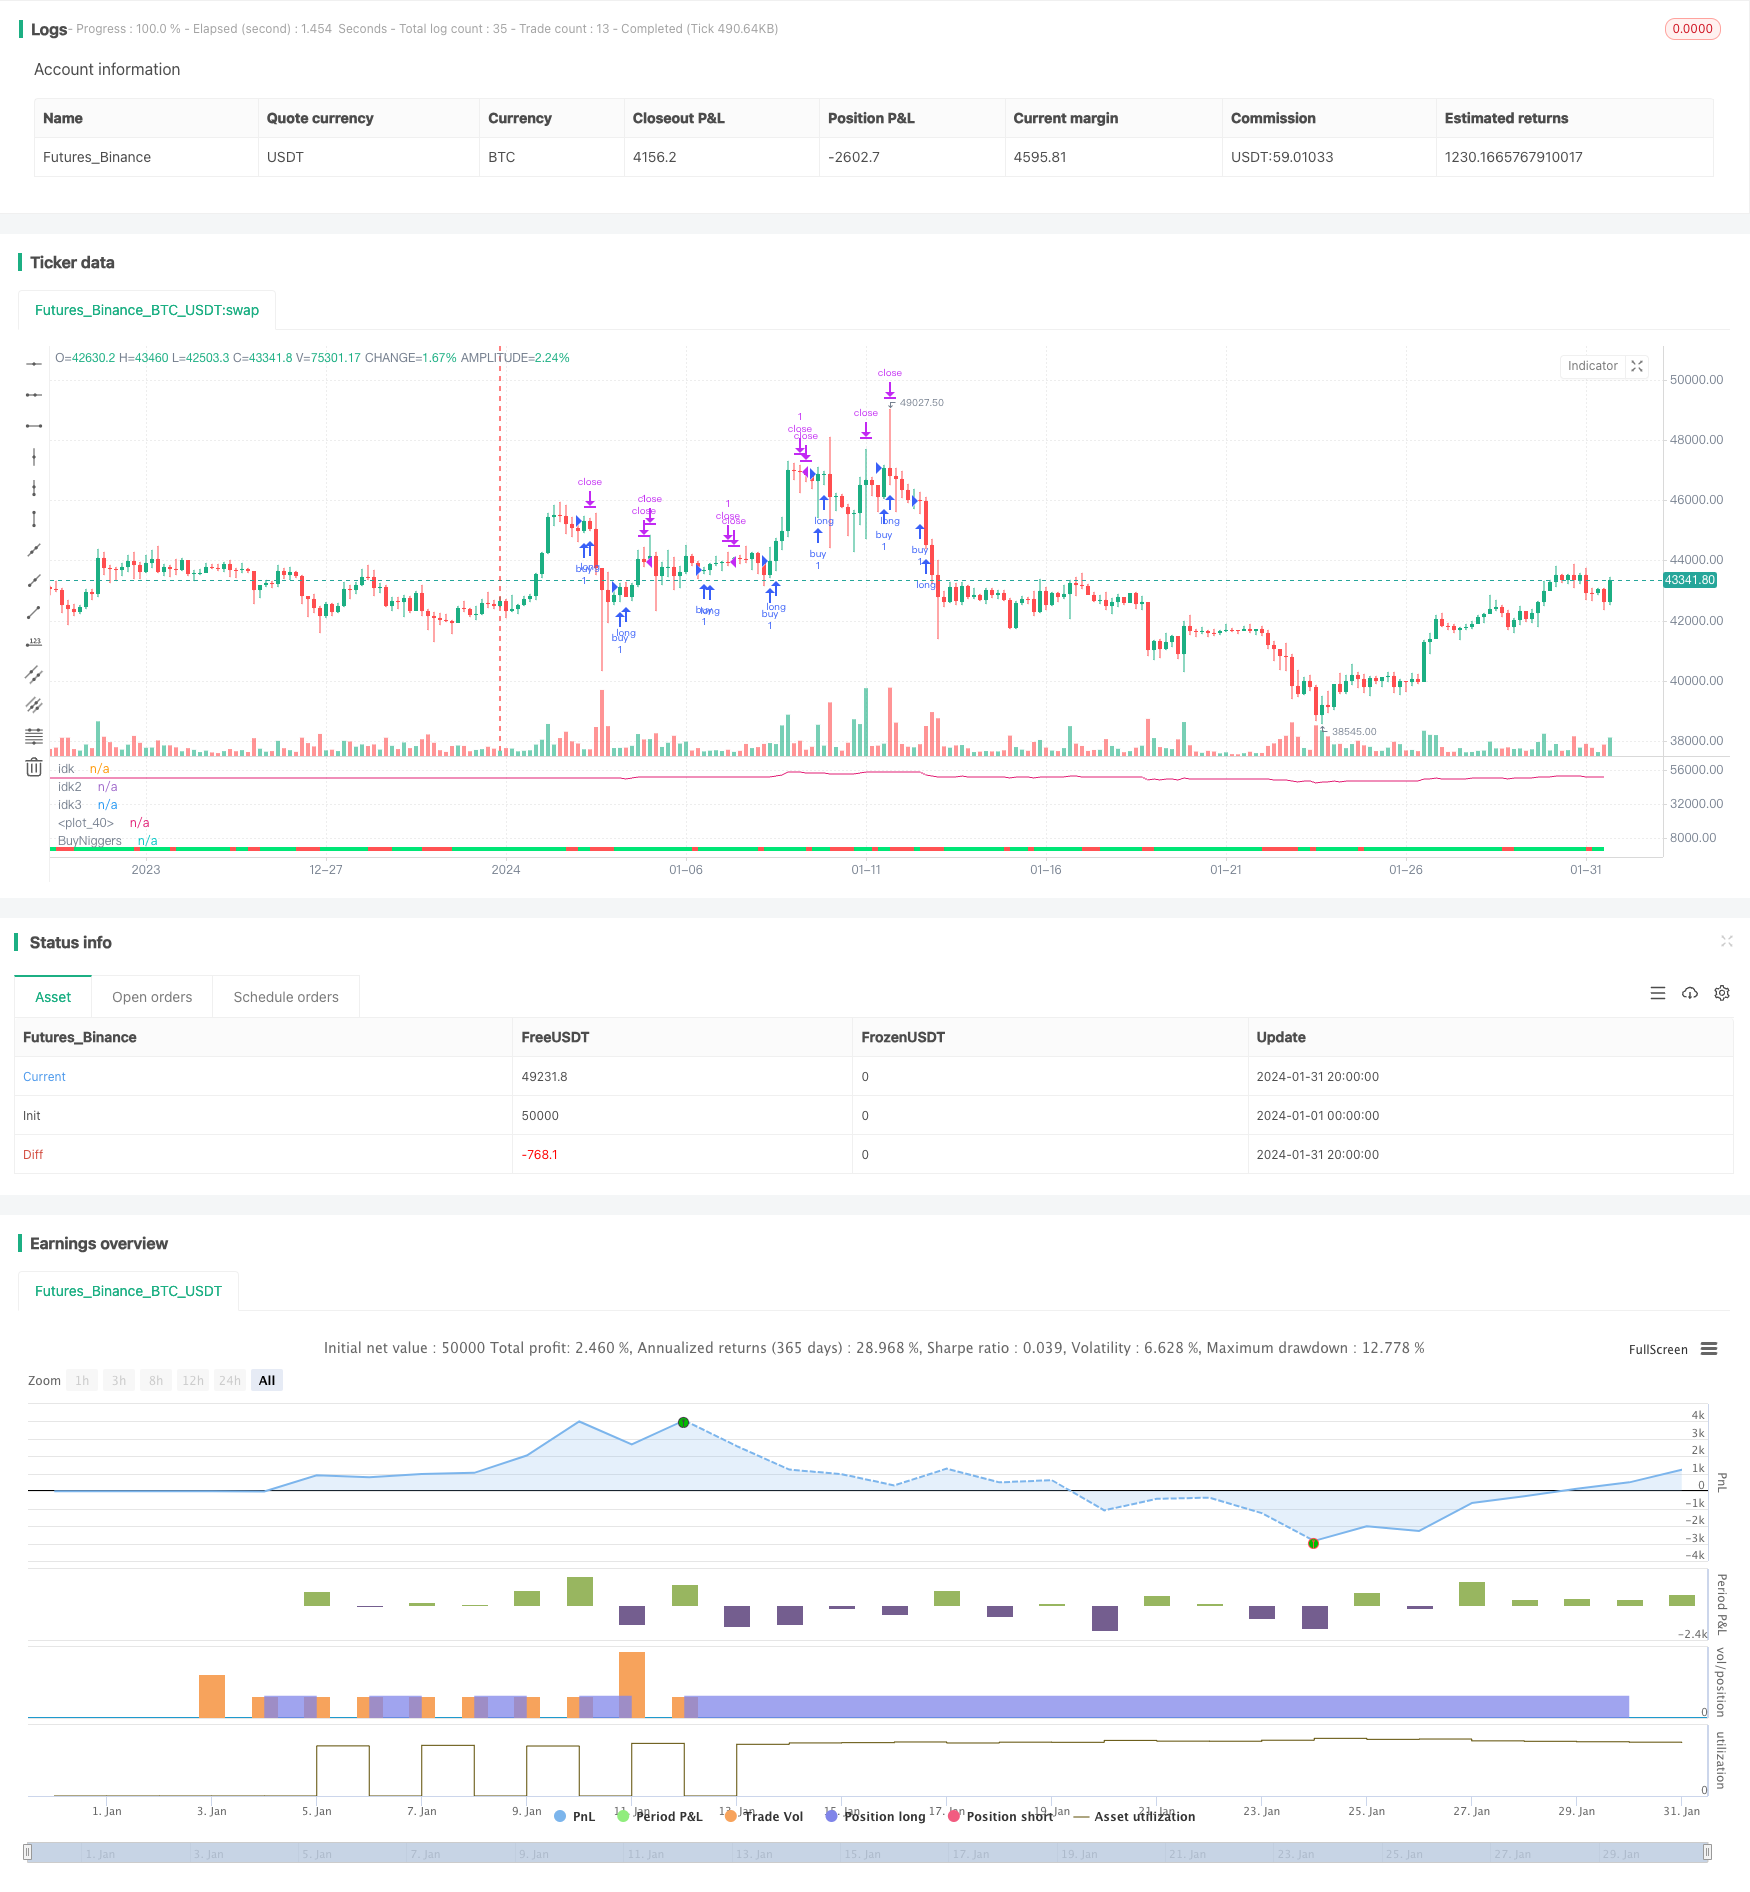
该策略通过计算RSI、阳线阴线指标和价格变化百分比排名的均值,构建自定义的综合指标CRSI,并计算其简单移动平均线MA,来判断价格趋势和产生交易信号。
策略原理
该策略首先计算价格的3日RSI,以判断价格是否过热或过冷;同时计算价格的阳线阴线指标,判断价格运动态势;此外还计算价格的百分比排名ROC,判断价格相对变化速度。然后取这三个指标的平均值,构建自定义综合指标CRSI。CRSI能反映价格的综合态势。最后计算CRSI的2日简单移动平均线MA。当MA上穿40这一水平线时,做多;当MA下穿70这一水平线时,平仓。
优势分析
该策略通过组合多个指标,构建自定义的CRSI指标,使得交易信号更可靠。RSI能判断价格是否过热过冷,阳线阴线指标能判断价格动量,ROC能判断价格变化速度。把它们结合在一起,形成CRSI指标,使得交易信号更全面和可靠。此外,MA的使用也能进一步过滤假信号。
风险分析
该策略虽然使用多个指标进行组合,但仍有可能在特定市场环境下产生错误信号。例如在震荡行情中,RSI、ROC等指标可能产生频繁的买卖信号,而实际上价格并没有明显趋势;或者在突发事件发生后,多个指标可能会有滞后,延迟生成交易信号的风险。这些情况都可能导致策略交易亏损。可以通过优化参数或增加其他过滤条件来降低这些风险。
优化方向
可以考虑以下几个方面来优化该策略:1)优化RSI、阳线阴线指标、ROC的参数,使得CRSI指标更稳定可靠;2)增加其他辅助指标进行组合,如KDJ、MACD等,使信号更全面;3)优化MA的参数,降低延迟风险;4)增加止损条件,以控制单笔亏损;5)结合更长周期指标判断趋势态势,避免在震荡市场中频繁交易。
总结
该策略通过计算RSI、阳线阴线和ROC的均线,构建CRSI自定义指标,再计算CRSI的MA,在MA与指定价格水平发生 Golden Cross和Death Cross时进行买卖操作。这种多指标组合可以使交易信号更稳定可靠。但该策略仍需进一步优化参数,增加辅助指标和过滤条件,以减少错误信号和市场环境的影响,提高稳定盈利能力。
/*backtest
start: 2024-01-01 00:00:00
end: 2024-01-31 23:59:59
period: 4h
basePeriod: 15m
exchanges: [{"eid":"Futures_Binance","currency":"BTC_USDT"}]
*/

//@version=3
src = close, lenrsi = 3, lenupdown = 2, lenroc = 100, malengt = 2, low = 40, high = 70, a = 1, vlow = 20
updown(s) =>
    isEqual = s == s[1]
    isGrowing = s > s[1]
    ud = 0.0
    ud := isEqual ? 0 : isGrowing ? (nz(ud[1]) <= 0 ? 1 : nz(ud[1])+1) : (nz(ud[1]) >= 0 ? -1 : nz(ud[1])-1)
    ud
rsi = rsi(src, lenrsi)
updownrsi = rsi(updown(src), lenupdown)
percentrank = percentrank(roc(src, 1), lenroc)
crsi = avg(rsi, updownrsi, percentrank)
MA = sma(crsi, malengt)

band1 = 70
band0 = 40
band2 = 20

ColorMA = MA>=band0 ? lime : red

p1 = plot(MA, title="BuyNiggers", style=line, linewidth=4, color=ColorMA)

p2 = plot(low, title="idk", style=line, linewidth=2, color=blue)
p3 = plot(high, title="idk2", style=line, linewidth=2, color=orange)
p4 = plot(vlow, title="idk3", style=line, linewidth=1, color=red)

//@version=2
strategy("CMARSI")


if crossover(MA, band0)
    strategy.entry("buy", strategy.long, 1, when=strategy.position_size <= 0)

if crossunder(MA, band1)
    strategy.exit("close", "buy",  1, profit=1, stop=1)


plot(strategy.equity)