Isolation Band Oscillation Tracking Strategy
Overview
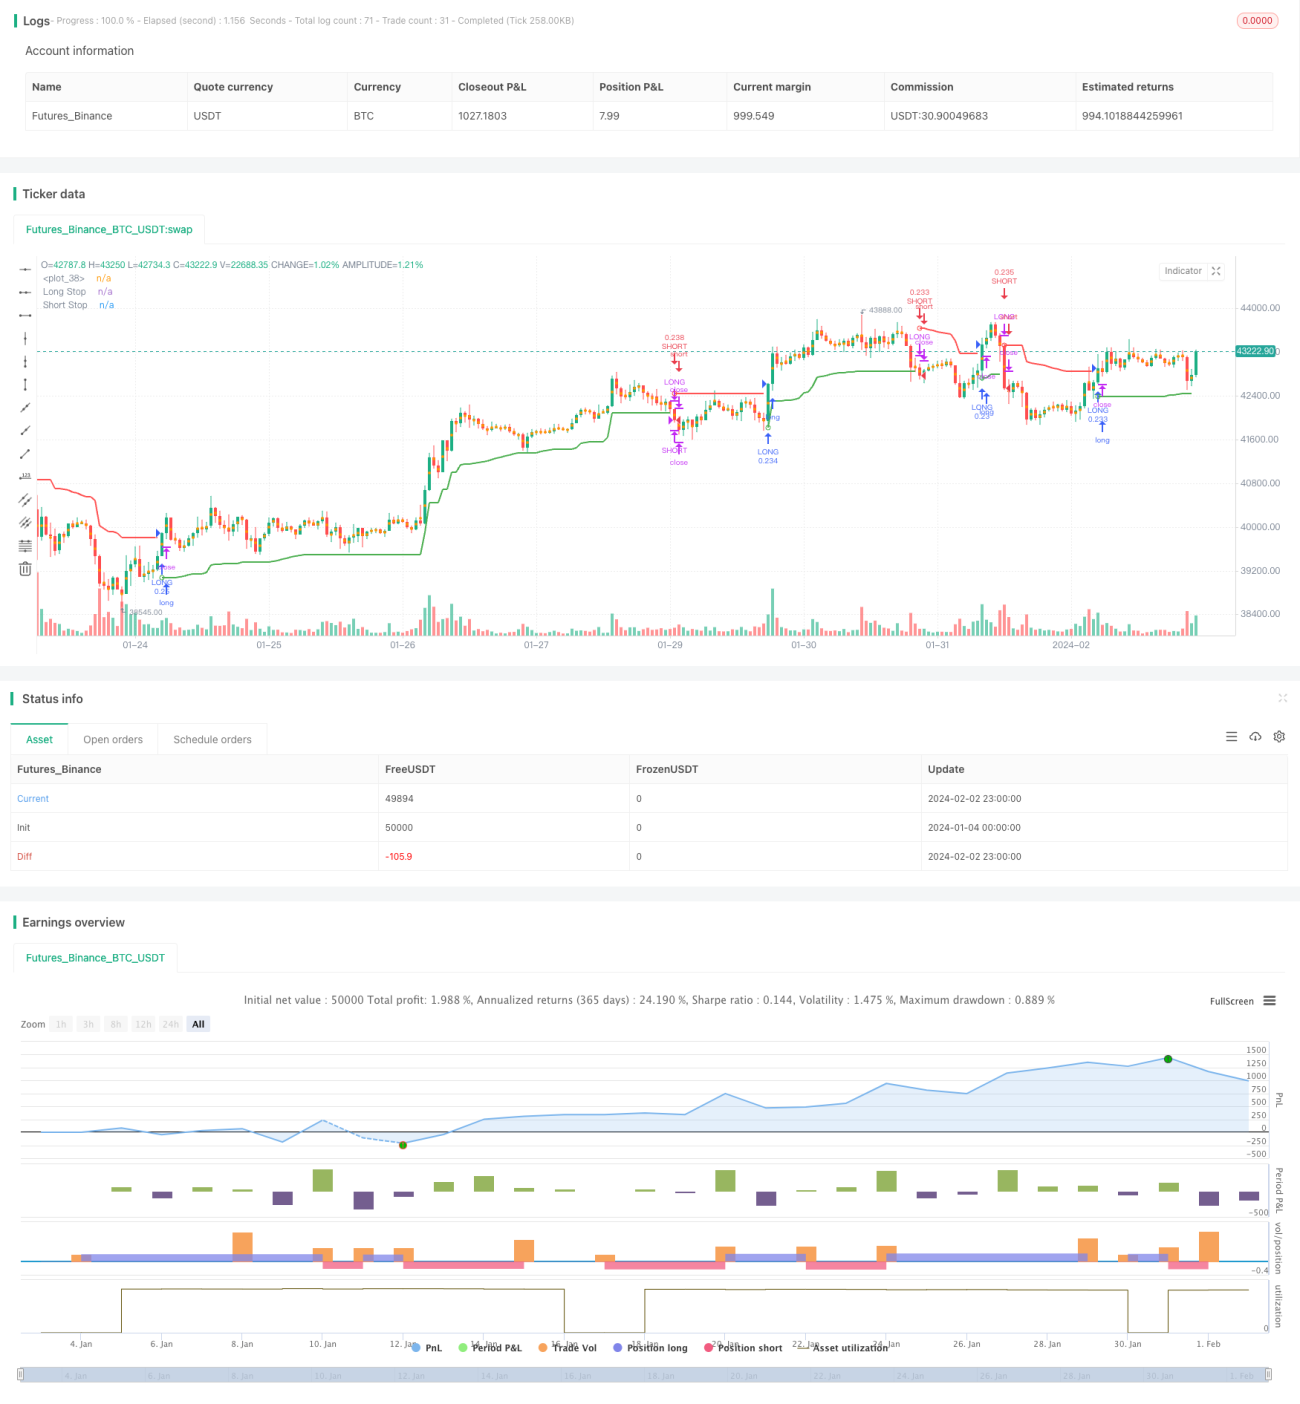
The main idea of this strategy is to calculate the long and short stop-loss lines based on the ATR indicator. It generates trading signals when the price breaks through these stop-loss lines. It has both trend tracking and oscillation capturing capabilities.
Strategy Principle
The strategy uses the N-period ATR multiplied by a coefficient to calculate the long and short stop-loss lines. The specific calculation formulas are as follows:
Long Stop = Highest Price - ATR * Coefficient
Short Stop = Lowest Price + ATR * Coefficient
It goes long when the price rises and breaks through the long stop-loss line, and goes short when the price falls and breaks through the short stop-loss line. After going long or short, it will track price fluctuations in real time to move the stop-loss lines.
By using the ATR band as the stop-loss level, this method can fully capture the price trend while ensuring the stop-loss risk. It generates signals when there is a significant breakthrough in price, which can effectively filter out false breakouts.
Advantage Analysis
The biggest advantage of this strategy is that it can automatically adjust the stop-loss level to capture price trends while controlling risks. The specific advantages are as follows:
-
The floating stop-loss based on the ATR indicator can adjust the stop-loss range according to market volatility to effectively control single loss.
-
Adopting a breakthrough method to generate signals can filter out some noise and avoid chasing peaks and bottoms.
-
Real-time adjustment of stop-loss lines to track price fluctuations prevents the stop-loss from being too loose and locks in more profits.
Risk Analysis
The strategy also has some risks, mainly concentrated in the setting of stop-loss level and signal generation. The specific risk points are:
-
Improper ATR cycle and coefficients may lead to excessively wide or narrow stop-loss.
-
The breakthrough signal method may miss early trend opportunities.
-
There may be some lag in stop-loss tracking during trend ending, unable to perfectly exit.
The countermeasures are mainly to adjust the parameters to make the stop-loss more reasonable, or assist with other indicators to determine the trend and signals.
Optimization Directions
The strategy can be further optimized in the following aspects:
-
Set up a second-layer stop-loss to further control risks.
-
Combine other indicators to determine the trend and improve signal quality.
-
Add moving stop-profit strategies to increase profit when the trend further continues.
-
Optimize ATR cycle and coefficient parameters to make stop-loss closer to actual price fluctuations.
Summary
Overall, this strategy is very practical. It can effectively control risks by automatically adjusting the stop-loss level, while obtaining good profits through trend tracking. We can further optimize and improve the strategy by combining other analytical methods on the existing basis to make it more stable and intelligent.
/*backtest
start: 2024-01-04 00:00:00
end: 2024-02-03 00:00:00
period: 1h
basePeriod: 15m
exchanges: [{"eid":"Futures_Binance","currency":"BTC_USDT"}]
*/
// This source code is subject to the terms of the Mozilla Public License 2.0 at https://mozilla.org/MPL/2.0/
// © melihtuna
//@version=4
strategy("Chandelier Exit - Strategy",shorttitle="CE-STG" , overlay=true, default_qty_type=strategy.cash, default_qty_value=10000, initial_capital=10000, currency=currency.USD, commission_value=0.03, commission_type=strategy.commission.percent)- 1

