概述
三指数均线止盈止损策略是一种基于三条不同周期的指数移动平均线进行入市出市的趋势跟踪策略。它同时使用平均真实波幅指标设置止盈止损位,实现风险管理。
策略原理
该策略使用三条指数移动平均线:快线、中线、慢线。当中线上穿慢线时做多;当快线下穿中线时平仓。这是一个典型的趋势跟踪策略,通过三条均线的多空转换判断趋势方向。
同时,该策略利用平均真实波幅指标计算止盈止损位。具体来说,多单止盈位为进场价格+平均真实波幅*止盈系数;空单止盈位为进场价格-平均真实波幅*止盈系数。止损原理与止盈相似。这可以有效限制单边风险。
优势分析
- 决策指标直观清晰,容易理解实现。
- 系统性强,容易量化。
- 兼顾趋势跟踪和风险控制。
风险分析
- 存在一定的滞后,无法及时捕捉转折。
- 震荡趋势中容易止损。
- 参数设置需要优化,否则实现效果不佳。
风险应对措施包括:适当缩短均线周期,优化止盈止损系数,添加其他决策指标辅助判断。
优化方向
- 多种均线指标组合,寻找最佳参数。
- 增加其他技术指标判断,如MACD、RSI等。
- 采用机器学习算法自动优化参数。
- 基于真实波幅动态调整止盈止损位。
- 结合情绪指标避免过度拥挤交易。
总结
该策略总体来说是一种效果稳定的趋势跟踪策略,简单参数设置,容易实现。通过平均真实波幅的动态止盈止损,可以限制单边风险。但需要注意参数优化和指标组合,防止过度优化和决策滞后。总体而言,风险收益平衡较好,值得考虑。
策略源码
/*backtest
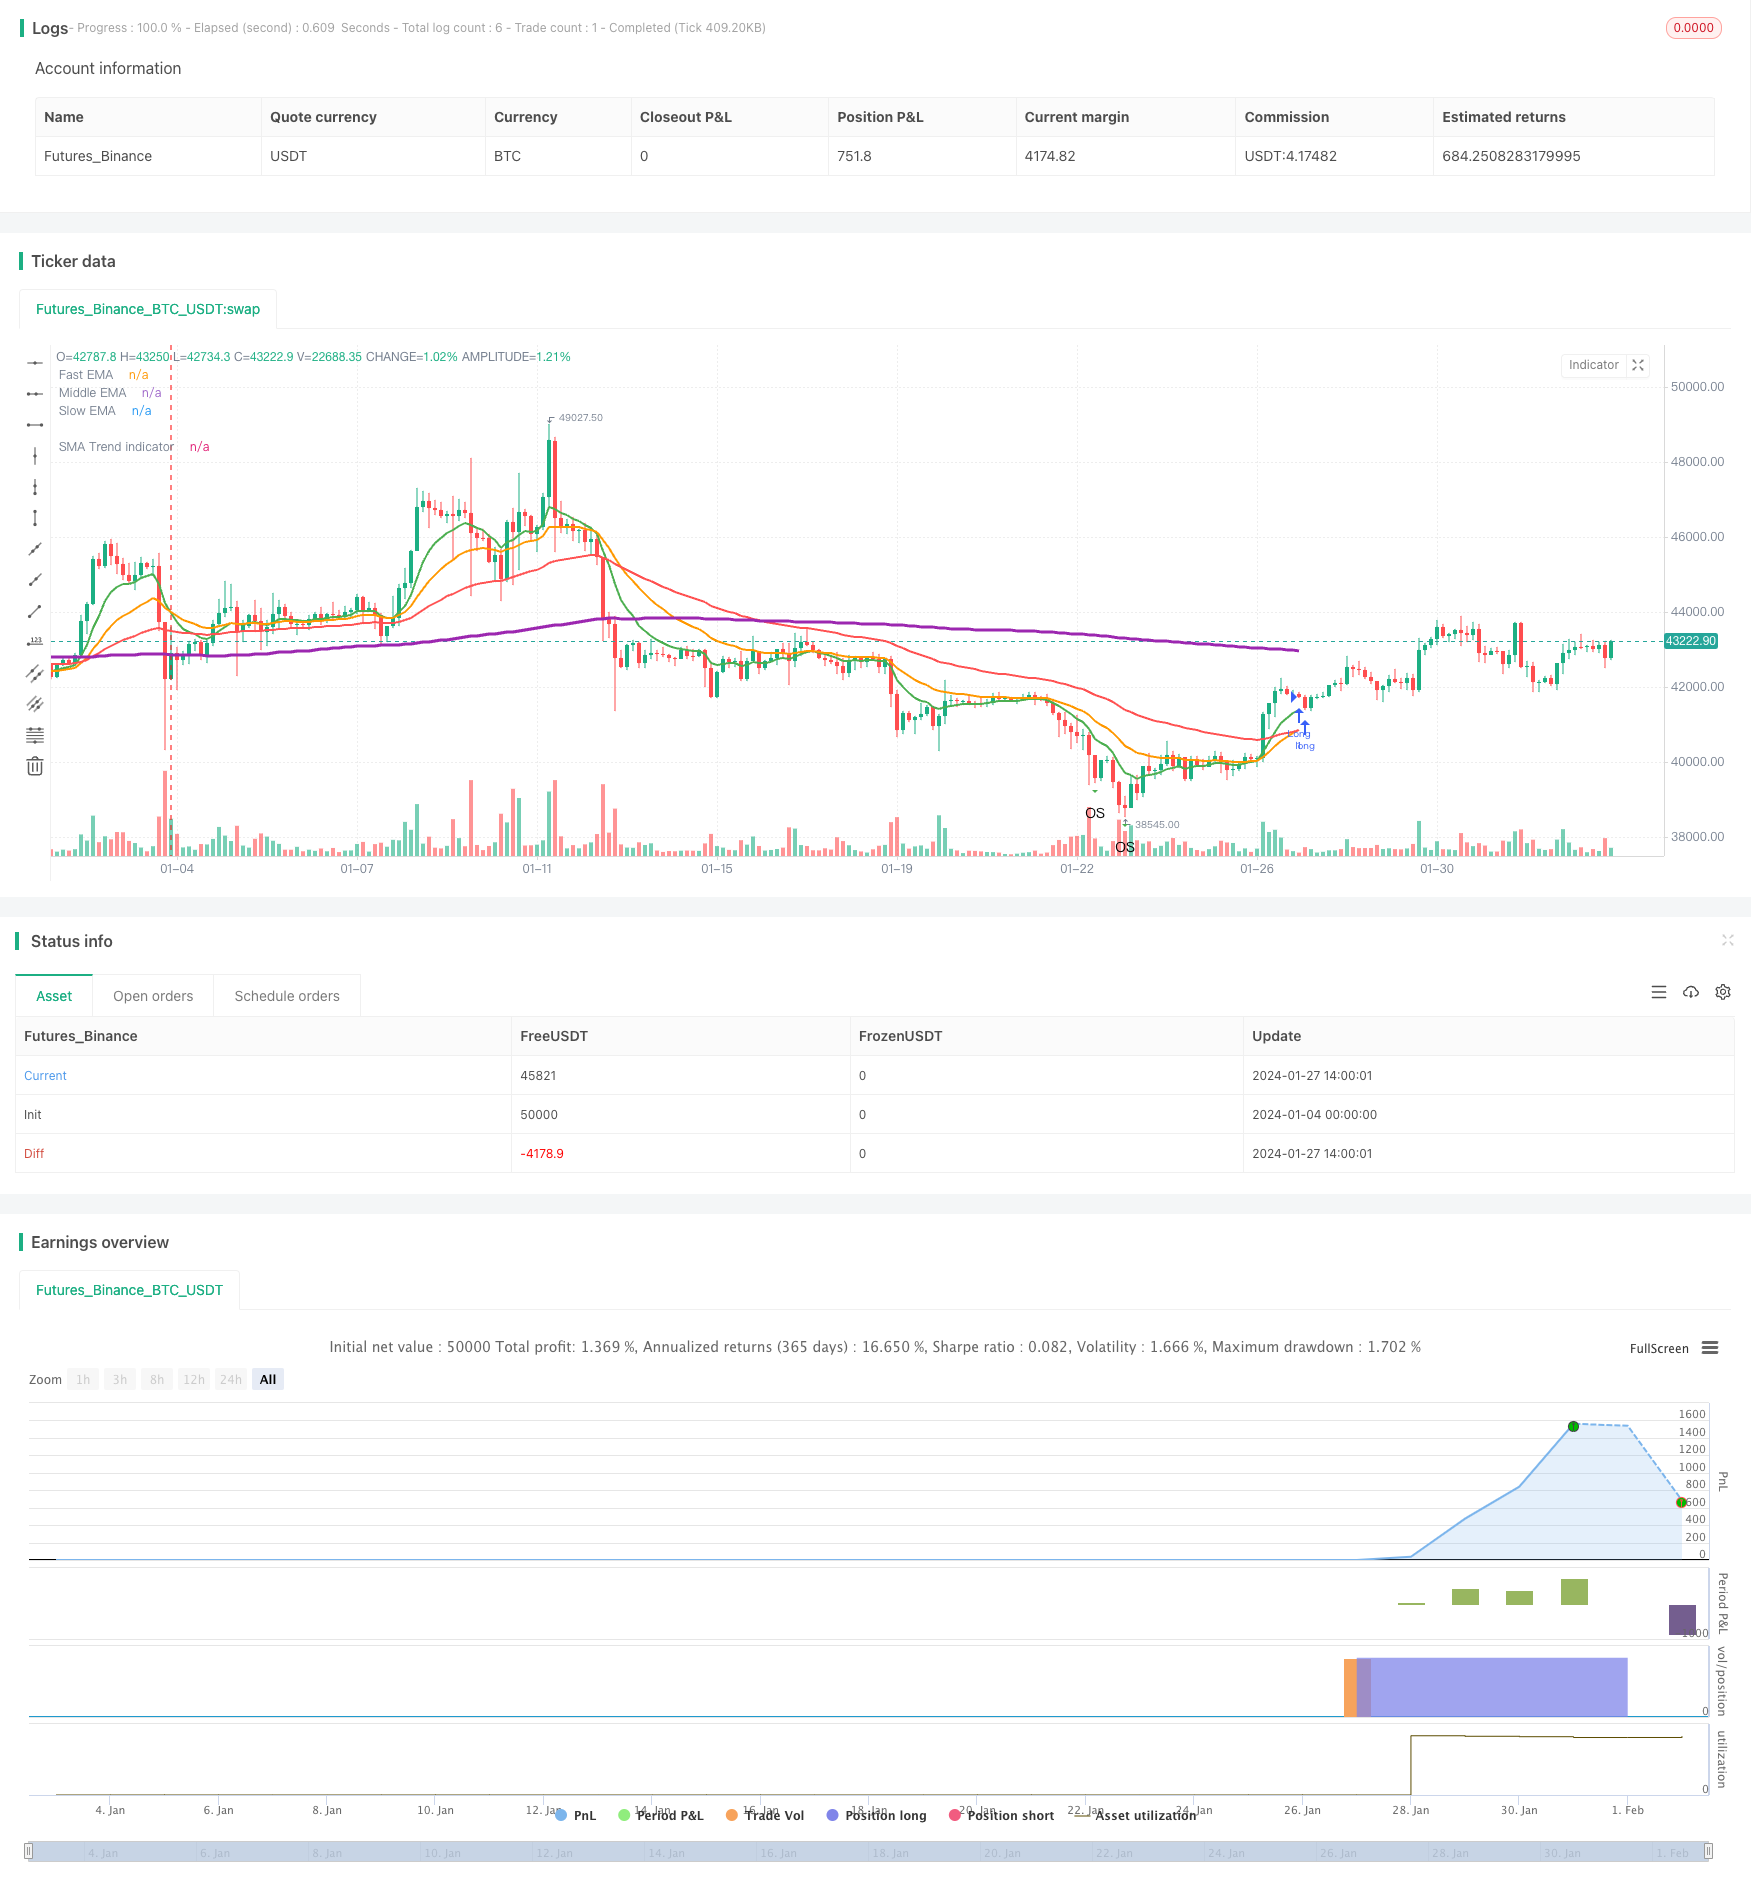
start: 2024-01-04 00:00:00
end: 2024-02-03 00:00:00
period: 3h
basePeriod: 15m
exchanges: [{"eid":"Futures_Binance","currency":"BTC_USDT"}]
*/
//@version=4
//© Densz
strategy("3EMA with TP & SL (ATR)", overlay=true )
// INPUTS
startTime = input(title="Start Time", type = input.time, defval = timestamp("01 Jan 2017 00:00 +0000"))
endTime = input(title="End Time", type = input.time, defval = timestamp("01 Jan 2022 00:00 +0000"))
slowEMALength = input(title="Slow EMA Length", type = input.integer, defval = 55)
middleEMALength = input(title="Middle EMA Length", type = input.integer, defval = 21)
fastEMALength = input(title="Fast EMA Length", type = input.integer, defval = 9)
trendMALength = input(title="Trend indicator MA Length", type = input.integer, defval = 200)
atrLength = input(title="ATR Length", type = input.integer, defval = 14)
tpATRMult = input(title="Take profit ATR multiplier", type = input.integer, defval = 3)
slATRMult = input(title="Stop loss ATR multiplier", type = input.integer, defval = 2)
rsiLength = input(title="RSI Length", type = input.integer, defval = 14)
// Indicators
slowEMA = ema(close, slowEMALength)
middEMA = ema(close, middleEMALength)
fastEMA = ema(close, fastEMALength)
atr = atr(atrLength)
rsiValue = rsi(close, rsiLength)
isRsiOB = rsiValue >= 80
isRsiOS = rsiValue <= 20
sma200 = sma(close, trendMALength)
inDateRange = true
// Plotting
plot(slowEMA, title="Slow EMA", color=color.red, linewidth=2, transp=50)
plot(middEMA, title="Middle EMA", color=color.orange, linewidth=2, transp=50)
plot(fastEMA, title="Fast EMA", color=color.green, linewidth=2, transp=50)
plot(sma200, title="SMA Trend indicator", color=color.purple, linewidth=3, transp=10)
plotshape(isRsiOB, title="Overbought", location=location.abovebar, color=color.red, transp=0, style=shape.triangledown, text="OB")
plotshape(isRsiOS, title="Oversold", location=location.belowbar, color=color.green, transp=0, style=shape.triangledown, text="OS")
float takeprofit = na
float stoploss = na
var line tpline = na
var line slline = na
if strategy.position_size != 0
takeprofit := takeprofit[1]
stoploss := stoploss[1]
line.set_x2(tpline, bar_index)
line.set_x2(slline, bar_index)
line.set_extend(tpline, extend.none)
line.set_extend(slline, extend.none)
// STRATEGY
goLong = crossover(middEMA, slowEMA) and inDateRange
closeLong = crossunder(fastEMA, middEMA) and inDateRange
if goLong
takeprofit := close + atr * tpATRMult
stoploss := close - atr * slATRMult
// tpline := line.new(bar_index, takeprofit, bar_index, takeprofit, color=color.green, width=2, extend=extend.right, style=line.style_dotted)
// slline := line.new(bar_index, stoploss, bar_index, stoploss, color=color.red, width=2, extend=extend.right, style=line.style_dotted)
// label.new(bar_index, takeprofit, "TP", style=label.style_labeldown)
// label.new(bar_index, stoploss, "SL", style=label.style_labelup)
strategy.entry("Long", strategy.long, when = goLong)
strategy.exit("TP/SL", "Long", stop=stoploss, limit=takeprofit)
if closeLong
takeprofit := na
stoploss := na
strategy.close(id = "Long", when = closeLong)
if (not inDateRange)
strategy.close_all()