Dual-Rail Parabolic SAR Bollinger Bands Strategy

Author: ChaoZhang, Date: 2024-02-04 10:44:45
Tags:

img

Overview

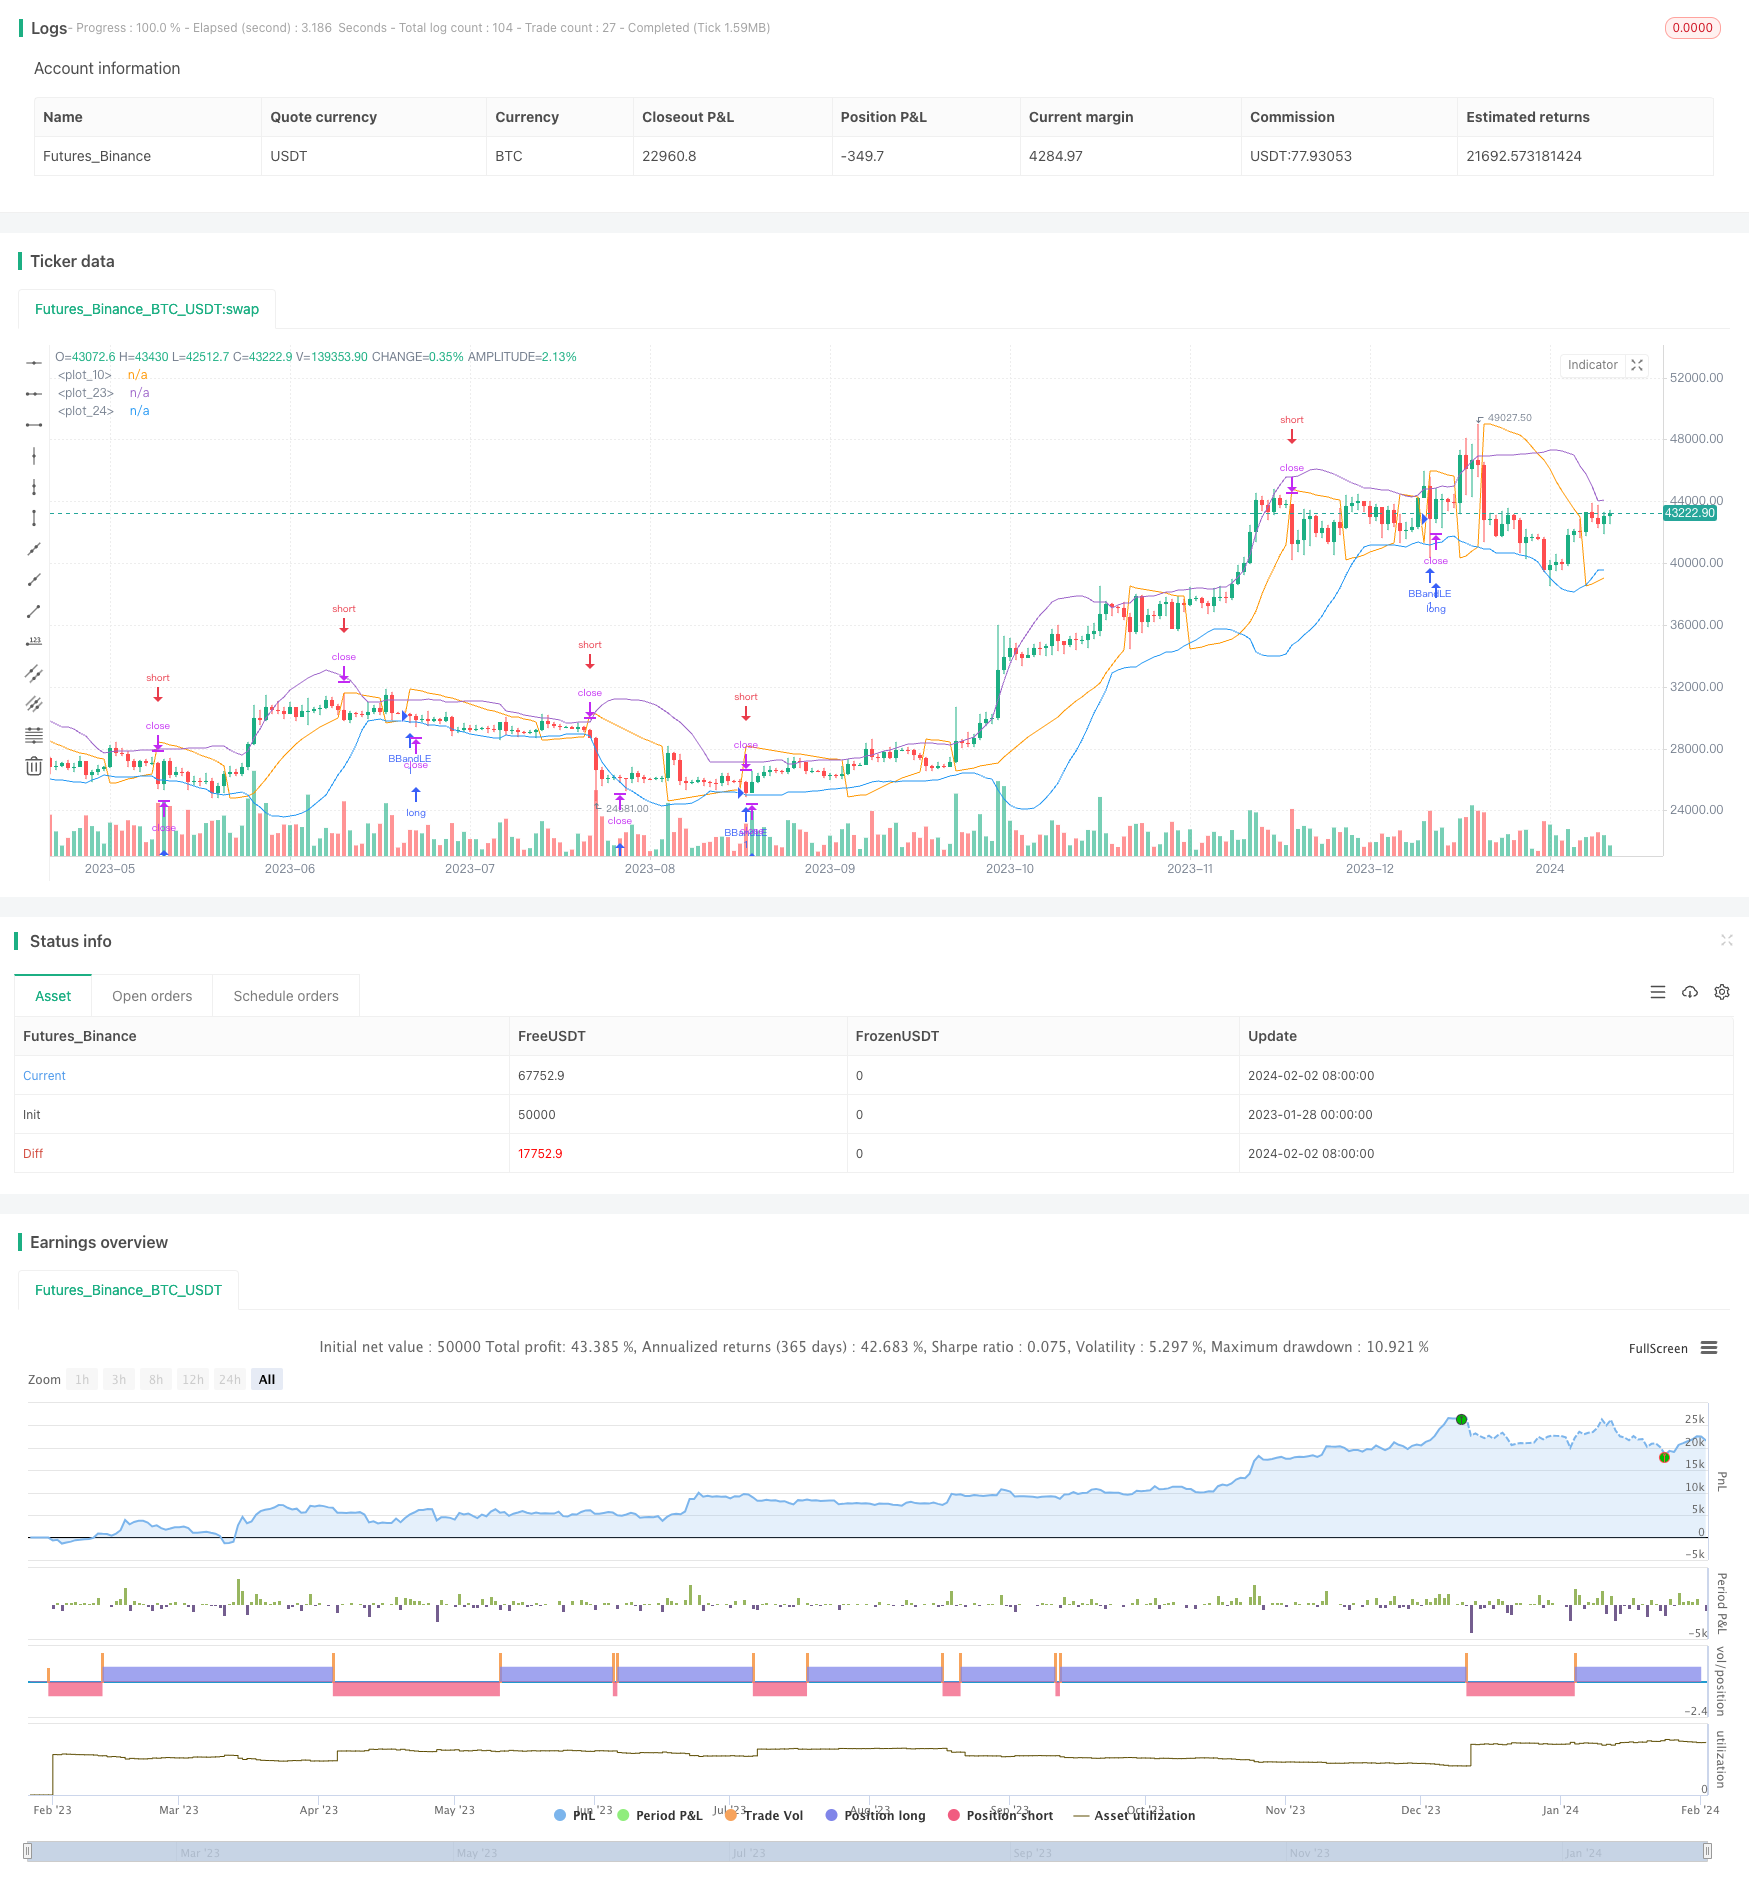
The Dual-Rail Parabolic SAR Bollinger Bands strategy combines the Bollinger Bands indicator and the PSAR indicator, going long when the Bollinger Lower Band is broken while going short when the PSAR indicator turns down, to more accurately capture trend reversal points. The strategy aims to capture upside opportunities when prices are in an uptrend channel while quickly switching to short when prices start to fall, allowing two-way trading.

Strategy Logic

The strategy first calculates the upper, middle and lower Bollinger Bands. The middle band is the N-day simple moving average of the closing price, while the upper and lower bands are k standard deviations above and below the middle band. The Parabolic SAR indicator is then calculated, with a sell signal triggered when it turns from up to down across the low.

On the long side, if the closing price falls below the Bollinger Lower Band, a long position is entered with a stop loss set at the lower band. When the PSAR reverses direction and goes below the low, a short position is entered, capturing the moment when the signal reverses.

Combining the trend-following nature of Bollinger Bands and the trend reversal characteristic of PSAR, the strategy can track trends and also timely capture reversal opportunities for two-way trading.

Advantages

  1. Improved accuracy from combining indicators. Bollinger Bands judge overall trends while PSAR catches local corrections, complementing each other.

  2. Trading with and against the trend. Bollinger Bands catch large trends while PSAR provides reversal signals to trade both ways.

  3. More two-way trading opportunities. The strategy profits from both upside and downside moves.

  4. Automatic stops limit risk. The adaptive stops based on the Lower Band and PSAR reduce the probability of large losses.

Risks

  1. Expanding bands could increase losses. Wider Bollinger Bands during volatile markets can place stops too far away, increasing risk.

  2. Ill-set PSAR parameters may cause missed reversals. Care is needed when setting the upside and downside parameters.

  3. Potentially excessive trades. PSAR is sensitive to minor moves which may trigger unnecessary trades, increasing costs.

Improvements

  1. Optimize Bollinger parameters for changing markets. Different combinations can be tested to find optimal settings across varying environments.

  2. Additional filters to remove false signals. Indicators like KDJ can supplement to avoid wrong signals from bad PSAR parameters.

  3. Reduce unnecessary trades. Minimum profit stops can prevent excessive minor reversals.

Conclusion

The Dual-Rail Parabolic SAR Bollinger Bands strategy fully utilizes Bollinger’s trend-following features and PSAR’s reversal identification to enable two-way trading, with and against trends. Compared to single indicators, combining signals significantly improves accuracy and increases correct trade opportunities on reduced false signals. Further enhancements through optimization and supplemental indicators can raise stability and profit factors.


//@version=3
strategy(title="Bollinger + sar", shorttitle="Bollinger + sar",
     overlay=true) 

start = input(0.02)
increment = input(0.02)
maximum = input(0.2)

psar = sar(start, increment, maximum)
plot(psar)


source = close
length = input(20, minval=1)
mult = input(2, minval=0.001, maxval=50)

basis = sma(source, length)
dev = mult * stdev(source, length)

upper = basis + dev
lower = basis - dev

plot(upper)
plot(lower)

if (lower >= low)
    strategy.entry("BBandLE", strategy.long, stop=lower, oca_name="BollingerBands",  comment="BBandLE")
else
    strategy.cancel(id="BBandLE")

if (psar <= low)
    strategy.entry("BBandSE", strategy.short, stop=psar, oca_name="BollingerBands", comment="BBandSE")
else
    strategy.cancel(id="BBandSE")


More