概述
动量震荡跨均线交易策略(Swing Trading Strategy Based on Momentum, Oscillation and Moving Average Crossover)是一个利用动量指标、震荡指标和移动平均线的交叉进行买卖信号的策略。它可以用于商品、外汇等市场的日内和日间交易。
策略原理
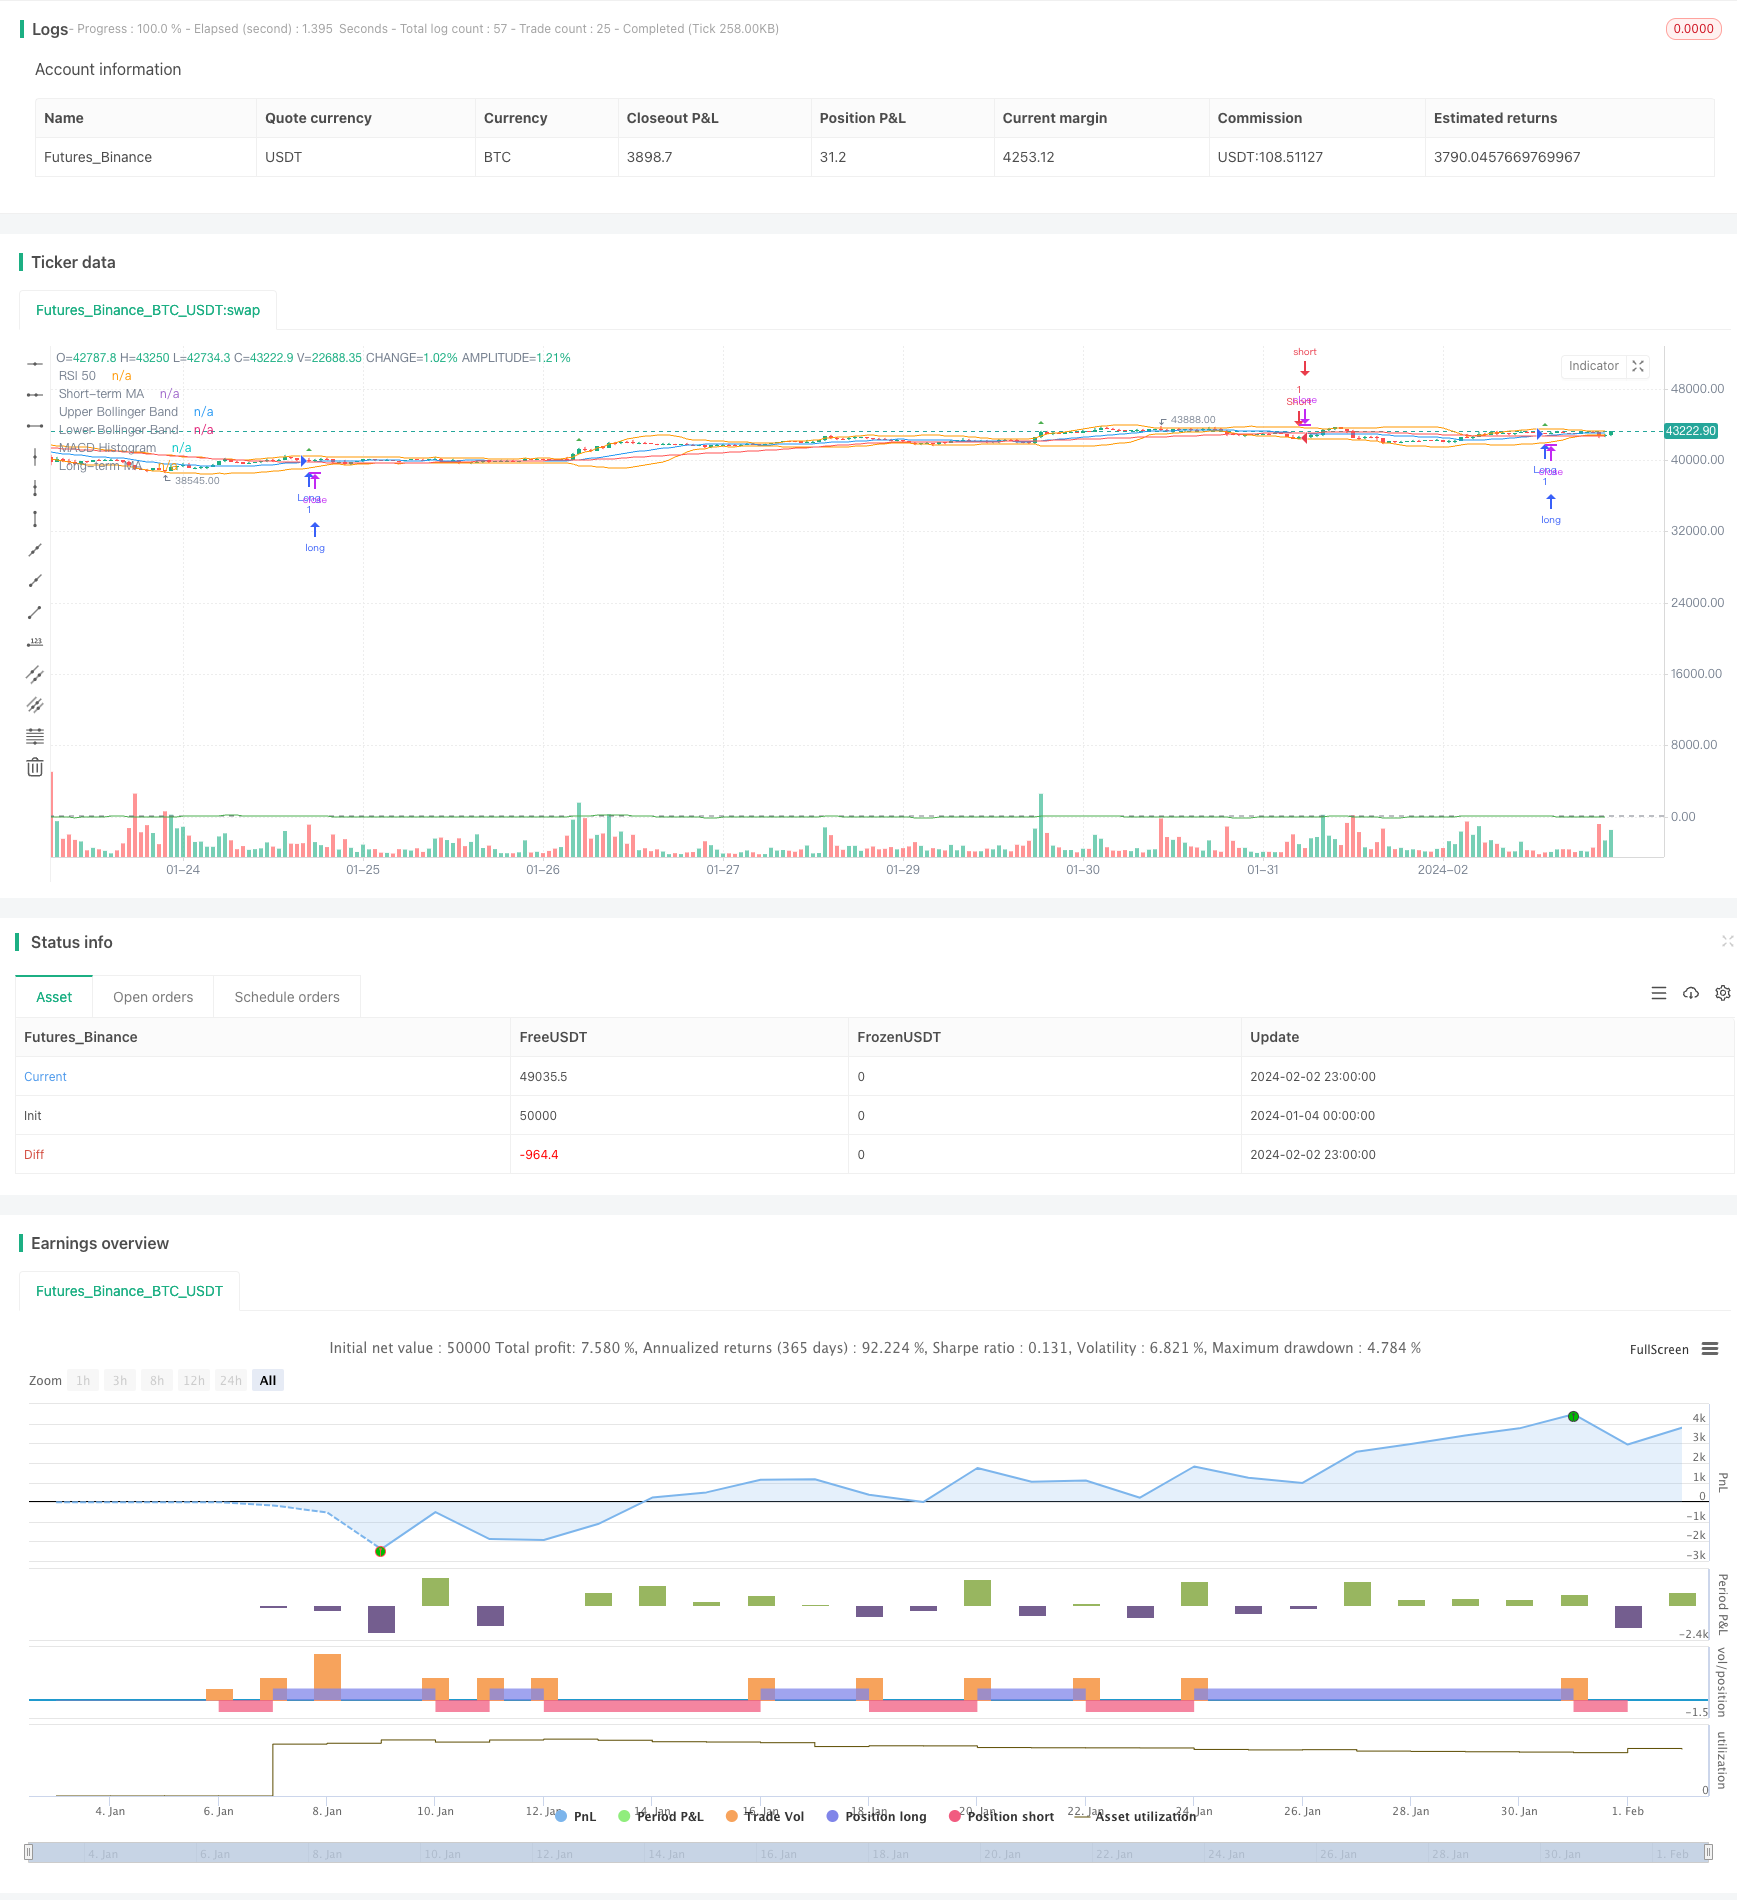
该策略同时使用了移动平均线、相对强弱指标(RSI)、MACD和布林带这四个技术指标来识别买入和卖出信号。具体逻辑是:
当短期移动平均线上穿长期移动平均线,并且RSI大于50时,做多;当短期移动平均线下穿长期移动平均线,并且RSI小于50时,做空。
这样的组合可以利用均线的黄金交叉和死亡交叉来判断趋势,同时加入RSI避免趋势逆转的风险。MACD的作用是确定买卖点,布林带则设置了止损位。
优势分析
该策略最大的优势是指标组合得当,可以有效利用趋势指标和震荡指标的互补性。具体来说:
- 移动平均线判断主要趋势方向和买卖信号点
- RSI用来避免趋势反转的风险
- MACD辅助确定具体的入场点位
- 布林带设置止损位
通过这种组合,可以充分发挥各个指标的优势,同时相互补足不足。
风险分析
该策略的主要风险有:
- 趋势反转风险。当市场快速反转时,移动平均线和RSI无法及时给出信号,可能导致损失加大。
- 震荡行情的虚假信号。当市场长期震荡时,移动平均线和RSI会频繁给出买卖信号,很容易被套住。
- 参数设置不当。如果参数设置不当,过滤效果会很差,容易产生错误信号。
为了控制这些风险,可以通过优化参数、设置止损止盈、合理控制仓位等方法进行管理。
优化方向
该策略可以从以下几个方面进行优化:
- 测试不同市场及不同周期参数组合,找到最佳参数。
- 增加波动率指标,可以更好地处理震荡行情。
- 增加交易量指标过滤信号,避免虚假突破。
- 结合深度学习算法实时优化参数,让系统更聪明。
- 优化止损止盈逻辑,让盈利更好、亏损更小。
总结
动量震荡跨均线交易策略利用趋势指标和震荡指标的优势互补性识别买卖信号,在参数优化和风险管理到位的情况,可以获得良好的效果。该策略可以进一步优化指标参数、止损逻辑等方面,从而获得更出色的表现。
策略源码
//@version=5
strategy("Swing Trading Strategy", overlay=true)

// Input for moving averages
shortMA = input(20, title="Short-term MA")
longMA = input(50, title="Long-term MA")

// Input for RSI
rsiLength = input(14, title="RSI Length")

// Input for MACD
macdShort = input(12, title="MACD Short")
macdLong = input(26, title="MACD Long")
macdSignal = input(9, title="MACD Signal")

// Input for Bollinger Bands
bbLength = input(20, title="Bollinger Bands Length")
bbMultiplier = input(2, title="Bollinger Bands Multiplier")

// Calculate moving averages
shortTermMA = ta.sma(close, shortMA)
longTermMA = ta.sma(close, longMA)

// Calculate RSI
rsiValue = ta.rsi(close, rsiLength)

// Calculate MACD
[macdLine, signalLine, _] = ta.macd(close, macdShort, macdLong, macdSignal)

// Calculate Bollinger Bands
basis = ta.sma(close, bbLength)
upperBand = basis + bbMultiplier * ta.stdev(close, bbLength)
lowerBand = basis - bbMultiplier * ta.stdev(close, bbLength)

// Plot moving averages
plot(shortTermMA, color=color.blue, title="Short-term MA")
plot(longTermMA, color=color.red, title="Long-term MA")

// Plot RSI
hline(50, "RSI 50", color=color.gray)

// Plot MACD
plot(macdLine - signalLine, color=color.green, title="MACD Histogram")

// Plot Bollinger Bands
plot(upperBand, color=color.orange, title="Upper Bollinger Band")
plot(lowerBand, color=color.orange, title="Lower Bollinger Band")

// Strategy conditions
longCondition = ta.crossover(shortTermMA, longTermMA) and rsiValue > 50
shortCondition = ta.crossunder(shortTermMA, longTermMA) and rsiValue < 50

// Execute trades
strategy.entry("Long", strategy.long, when=longCondition)
strategy.entry("Short", strategy.short, when=shortCondition)

// Plot trade signals on the chart
plotshape(series=longCondition, title="Long Signal", color=color.green, style=shape.triangleup, size=size.small)
plotshape(series=shortCondition, title="Short Signal", color=color.red, style=shape.triangledown, size=size.small)