概述
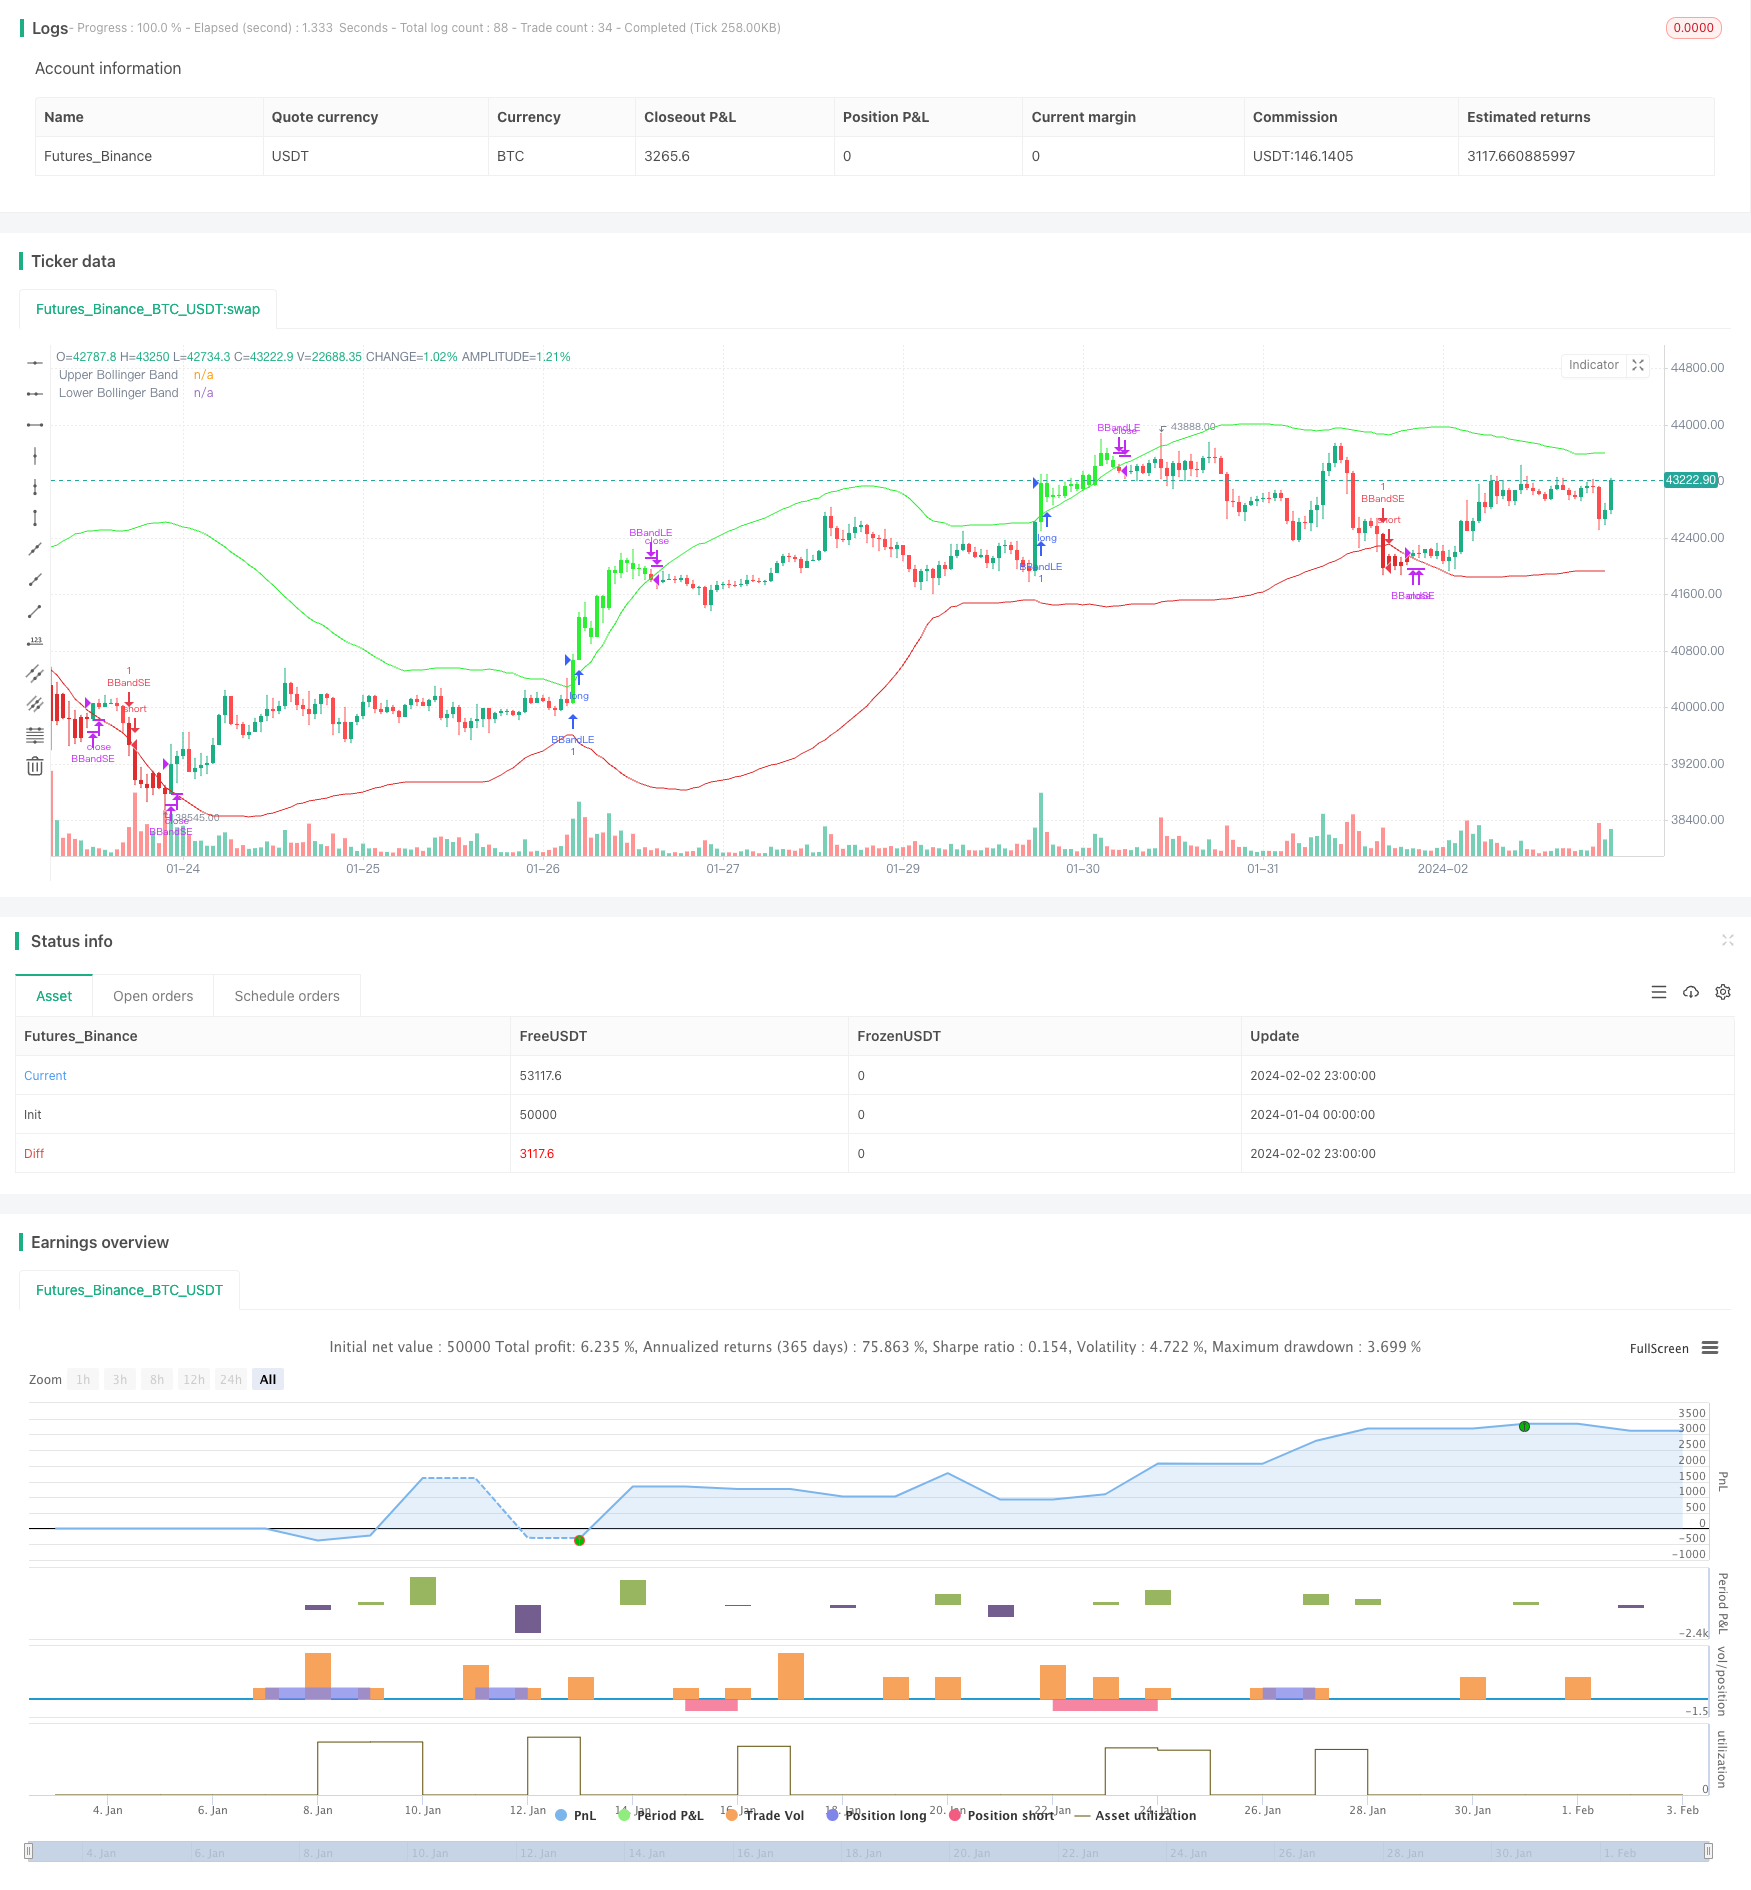
本策略通过计算布林带的上轨、中轨、下轨,并结合K线的收盘价进行判断,实现布林带突破交易策略。当价格突破上轨时,做多;当价格突破下轨时,做空。同时设置止损和止盈价格。
策略原理
计算布林带的中轨SMA,长度为60周期,代表价格趋势的中轨。
计算布林带上下轨,上轨为中轨+2倍标准差,下轨为中轨-2倍标准差,带宽通过多值控制。
当收盘价大于上轨时,做多入场;当收盘价小于下轨时,做空入场。
设置止损止盈机制。止损比例为1.5%,止盈比例为6%。
当价格重新进入布林带时或触发止损止盈退出位置时,平仓离场。
优势分析
使用布林带指标判断价格突破,具有较强的趋势判断能力。
策略操作简单,容易理解实现。
设置止损止盈机制控制风险。
风险分析
布林带突破并不能准确判断价格趋势反转点,可能出现虚假突破的风险。
止损止盈设置不合理可能带来更大的风险。
交易频率可能较高,需要考虑交易成本的影响。
优化方向
结合其他指标过滤虚假突破信号。例如KDJ指标判断趋势,MACD判断背离。
动态调整布林带参数,根据市场波动率计算合理带宽。
优化止损止盈策略,trailing stop或分批止损止盈。
考虑交易成本的影响,调整持仓时间。
总结
本策略通过布林带指标判断价格突破实现趋势following,具有一定的效果。但可能出现虚假突破 bringing更大风险。可以考虑与其他指标组合,并不断测试优化参数,以控制风险和提高盈利能力。
策略源码
/*backtest
start: 2024-01-04 00:00:00
end: 2024-02-03 00:00:00
period: 1h
basePeriod: 15m
exchanges: [{"eid":"Futures_Binance","currency":"BTC_USDT"}]
*/

//@version=5
strategy("Fuera Bolinga", overlay=true)

length = input.int(60, minval=1)
mult = input.float(2.0, minval=0.001, maxval=50)
take_profit_percentage = 6.0

basis = ta.sma(close, length)
dev = mult * ta.stdev(close, length)
upper = basis + dev
lower = basis - dev

stop_loss_percentage = 1.5

// Determinar si la vela cierra por fuera de las bandas
above_upper_band = close > upper
under_lower_band = close < lower

// Pintar las velas que cierran por fuera de las bandas
barcolor(above_upper_band ? color.new(#2cee32, 0) : na)
barcolor(under_lower_band ? color.new(#e02c2c, 0) : na)

// Entrada larga con stop loss y take profit
if (ta.crossover(close, upper))
    strategy.entry("BBandLE", strategy.long, oca_name="BollingerBands",  comment="BBandLE")
else
    strategy.cancel(id="BBandLE")

// Entrada corta con stop loss y take profit
if (ta.crossunder(close, lower))
    strategy.entry("BBandSE", strategy.short, oca_name="BollingerBands",comment="BBandSE")
else
    strategy.cancel(id="BBandSE")

//// Salida de operación larga
if ((ta.crossunder(close, upper) or ta.crossunder(close, lower)) and (strategy.opentrades != 0))
    strategy.close("BBandLE")

// Salida de operación corta
if ((ta.crossover(close, lower) or ta.crossover(close, upper)) and (strategy.opentrades != 0))
    strategy.close("BBandSE")

// Plot de las bandas de Bollinger
plot(upper, color=color.new(#2cee32, 0), title="Upper Bollinger Band")
plot(lower, color=color.new(#e02c2c, 0), title="Lower Bollinger Band")