概述
该策略通过计算MACD指标及其MACD柱状线,检测MACD柱状线与价格走势之间的背离信号,进而产生交易信号。当检测到价格新高但MACD柱状线没有创出新高时,产生看跌背离信号;当检测到价格新低但MACD柱状线没有创出新低时,产生看涨背离信号。结合ATR指标,设置止损位和止盈位,进行趋势跟踪交易。
策略原理
该策略的核心原理是利用MACD指标及其MACD柱状线反映价格趋势变化的特性,检测MACD柱状线与价格之间的背离信号,作为交易信号的触发条件。
具体来说,策略首先计算MACD线、Signal线和MACD柱状线。然后通过定义 fractal 函数,检测 MACD柱状线 的 peak 和 valley,提取局部极大值和极小值点。再结合价格的最高价和最低价,判断 MACD柱状线 与价格之间是否存在背离。
当价格创出新高,但 MACD柱状线没有创出新高时,产生 regulark_bearish_div 看跌背离信号;当价格创出新低,但 MACD柱状线没有创出新低时,产生 regulark_bullish_div 看涨背离信号。
最后,策略在看跌背离和看涨背离信号产生时,分别发出做空和做多指令,并以 ATR 止损、止盈退出仓位。
优势分析
该策略具有以下几个优势:
利用 MACD柱状线与价格之间的背离特征,可提前捕捉到价格趋势的转变。
ATR止损止盈设置合理,可有效控制单笔交易的最大亏损。
采用趋势跟踪方法,可最大限度锁住利润。
参数设置合理,可过滤掉部分噪音交易信号。
策略逻辑清晰易懂,容易实盘验证。
风险分析
该策略也存在一些风险:
MACD背离不一定会带来价格的反转,存在一定的假信号风险。
止损止盈设置不合理可能导致亏损过大或利润太小。
背离信号周期偏短,可能是噪音造成,应适当过滤。
交易品种和参数设置不匹配,也会影响策略效果。
对应解决方法:
适当增大背离长度和背离幅度要求,过滤假信号。
用 ATR 作为止损止盈指标,并调整ATR 倍数,控制单笔交易风险。
针对不同交易品种选取不同参数。进行参数优化,找到最佳参数组合。
优化方向
该策略还可从以下几个方向进行优化:
更复杂的背离确认,如 Volume 背离确认。
优化 MACD 参数,寻找最佳参数组合。
优化 ATR 止损止盈的倍数。
增加机器学习算法,辅助判断背离信号的可靠性。
增加模型预测,判断价格反转概率。
根据市场环境变化,动态调整策略参数。
总结
总的来说,该毕达哥蜡烛图MACD指标背离趋势跟踪策略,利用 MACD柱状线与价格之间的背离特征,实现趋势的捕捉。ATR 止损止盈设置合理,可控制单笔交易风险。该策略逻辑清晰易懂,值得实盘检验。后续可从多方面进行策略优化,以获得更好的效果。
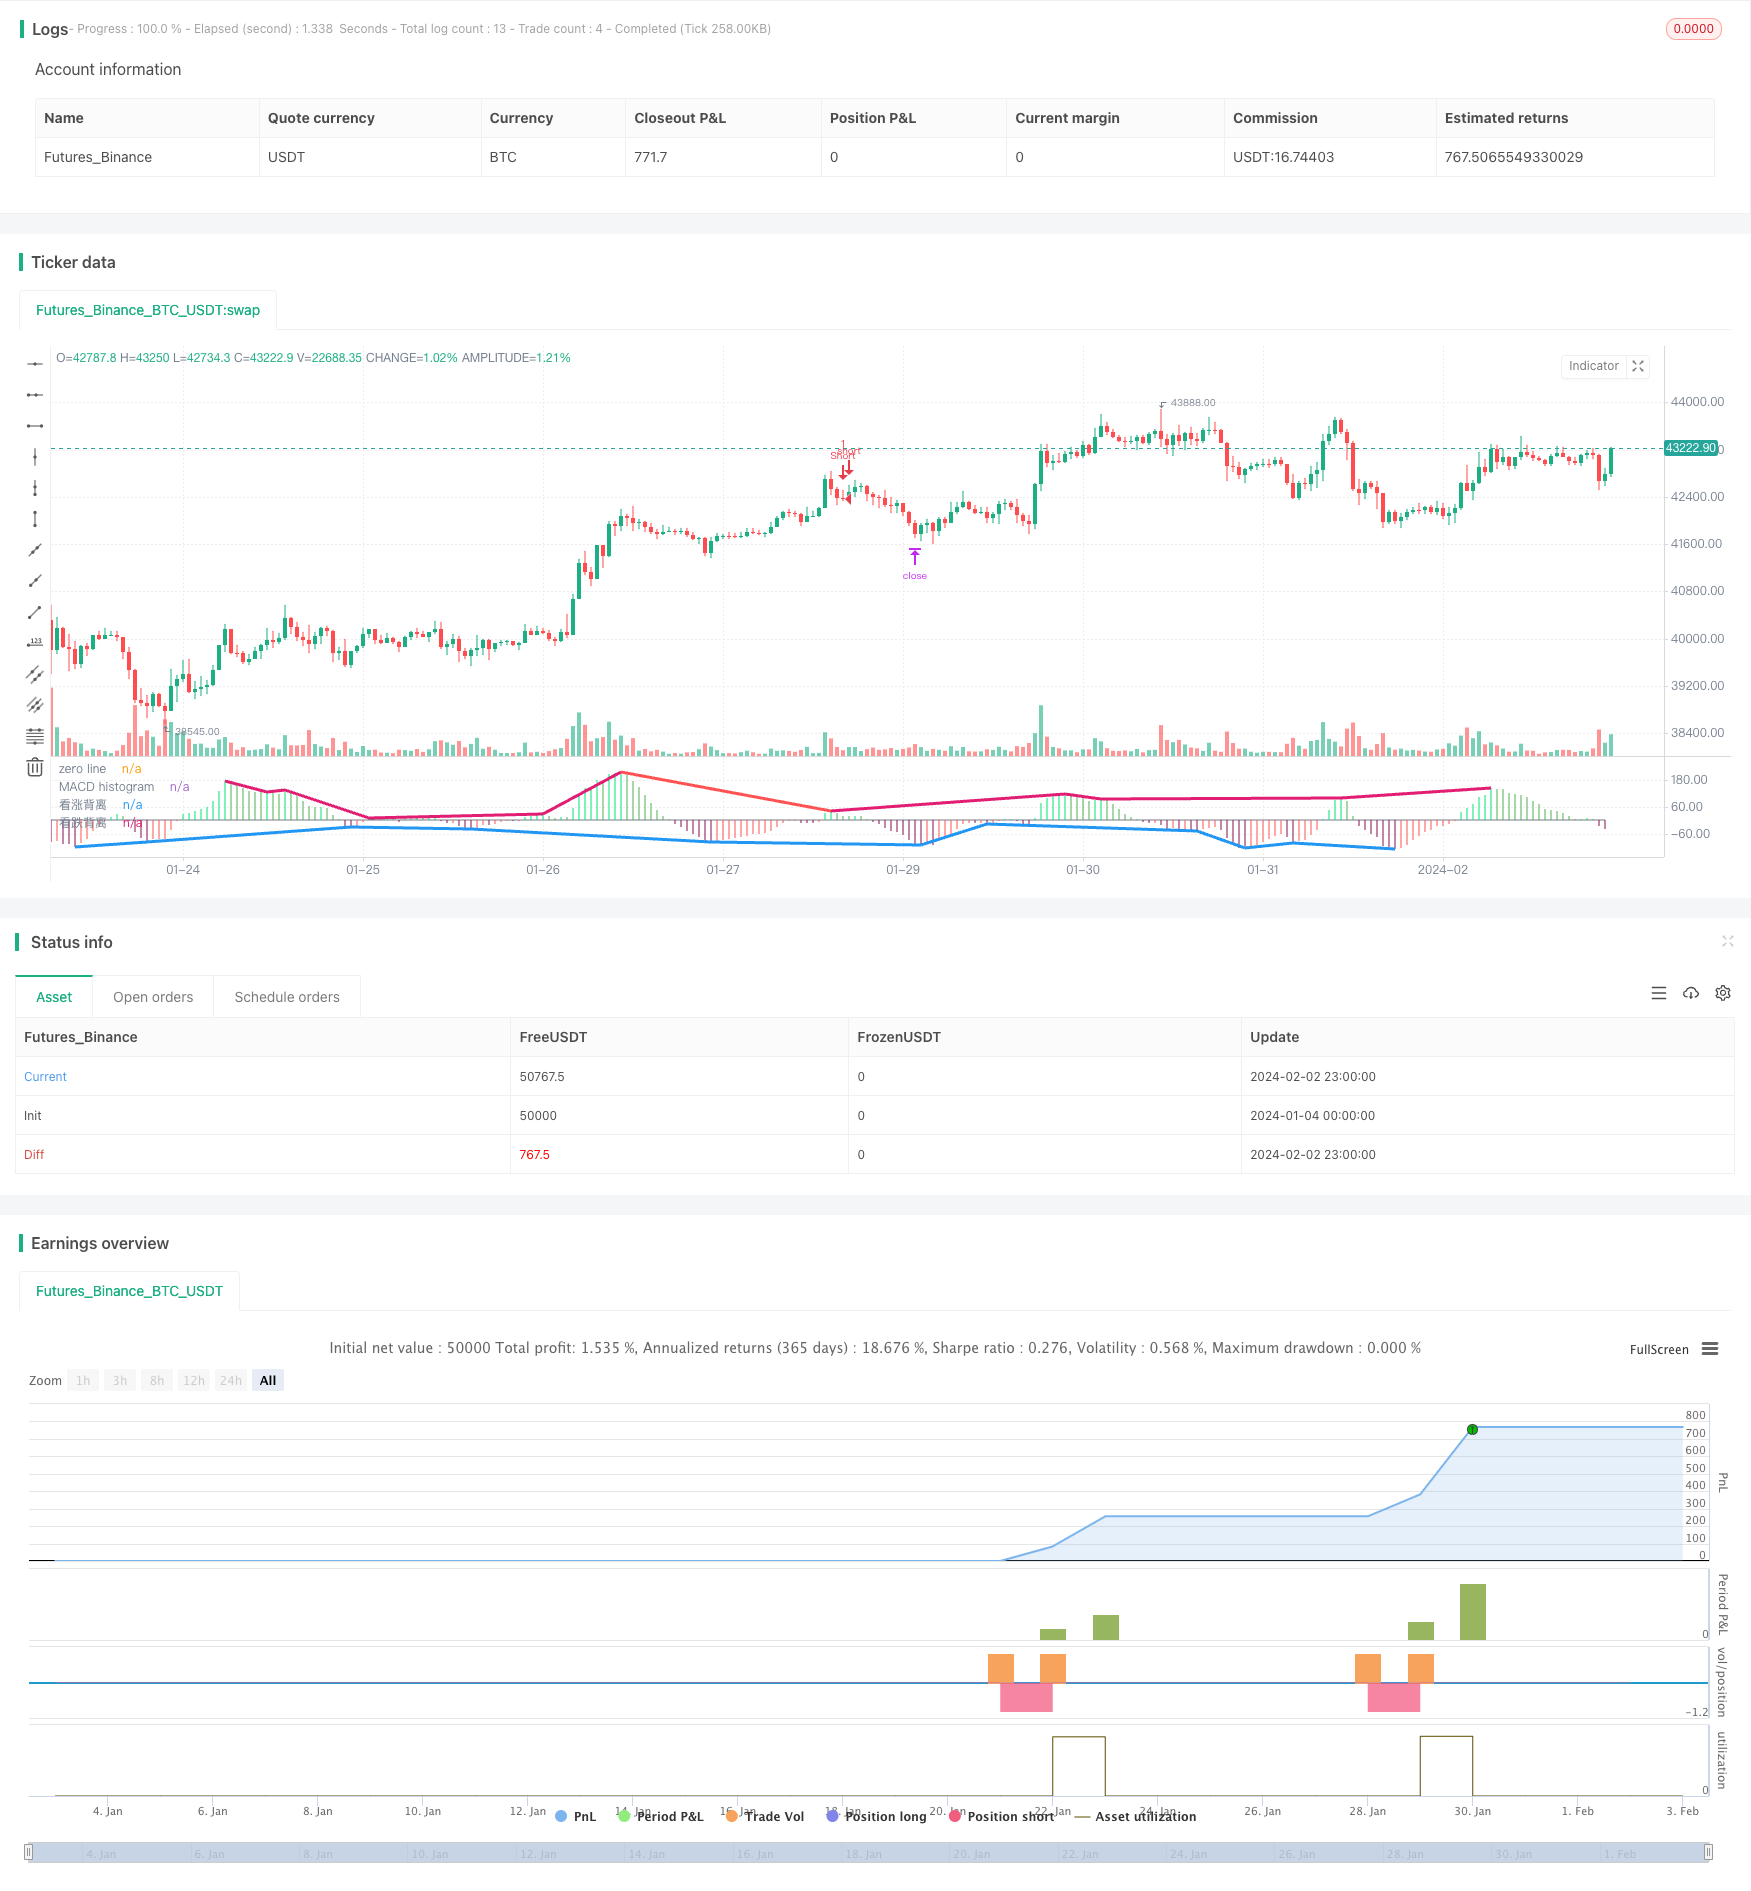
/*backtest
start: 2024-01-04 00:00:00
end: 2024-02-03 00:00:00
period: 1h
basePeriod: 15m
exchanges: [{"eid":"Futures_Binance","currency":"BTC_USDT"}]
*/

// This Pine Script™ code is subject to the terms of the Mozilla Public License 2.0 at https://mozilla.org/MPL/2.0/
// © bigwin_sun
// copyright: Tradingvue Limited

//@version = 5
strategy(title = "Demigod : CDMA histogram Divergence strategy", shorttitle = "Demigod strategy", overlay = false, pyramiding = 100)

//macd input
fastMA = input.int(13, title = "fast Length", minval = 1,     group = "CDMA")
slowMA = input.int(34, title = "slow Length", minval = 1,     group = "CDMA")
src          = input.source(title = "source", defval = close, group = "CDMA")
signalSmooth = input.int(9, title="ma Length", minval = 1,    group = "CDMA")
//Divergenc
divLength    = input.int(title = "Divergenc Length",   defval = 5, minval = 1,   maxval = 50,  inline = "ATRLength",  group = "Divergence")
divStren     = input.float(title="Divergenc Strength", defval = 2, minval = 1.0, maxval = 5.0, inline = "ATRLength",  group = "Divergence")

//atr input
atrLength = input.int(13, title = "ATR Length", minval = 1,   inline = "ATRLength", group = "ATR")
m         = input.float(1.0,  "ATR multyple",   minval = 0.5, inline = "ATRLength", group = "ATR", step = 0.5)
collong   = input.color(color.teal, title = "upper color",  inline = "ATR显示", group = "ATR")
colshort  = input.color(color.red,  title = "under color",  inline = "ATR显示", group = "ATR")

// MACD---------------------------------------------------------------------------------------------------------------------------------
DivOffset = -2
macdLine   = ta.ema(src, fastMA) - ta.ema(src, slowMA)
signalLine = ta.ema(macdLine, signalSmooth)
histogram  = macdLine - signalLine

histogramColor = if histogram > 0
    histogram > histogram[1] ? color.lime : color.green
else
    histogram < histogram[1] ? color.maroon : color.red

// cdma histogram
plot(histogram, title = "MACD histogram", linewidth = 2, style = plot.style_histogram, color = histogramColor)
plot(0,         title = "zero line",      linewidth = 1,                               color = color.gray)

// Divergenc calculation-------------------------------------------------------------------------------------------------------------------------------------------------------------------------------
//peak / valley fundation
f_top_fractal(_src)=>_src[4] < _src[2] and _src[3] < _src[2] and _src[2] > _src[1] and _src[2] > _src[0] and _src > 0
f_bot_fractal(_src)=>_src[4] > _src[2] and _src[3] > _src[2] and _src[2] < _src[1] and _src[2] < _src[0] and _src < 0
f_fractalize(_src)=>f_top_fractal(_src) ? 1 : f_bot_fractal(_src) ? -1 : 0

//peak / valley value
fractal_top1 = f_fractalize(histogram) > 0 ? true : false //histogram[2] : na
fractal_bot1 = f_fractalize(histogram) < 0 ? true : false //histogram[2] : na

//previouse peak or valley
high_prev1  = ta.valuewhen(fractal_top1, histogram[2], 0)[2]
high_price1 = ta.valuewhen(fractal_top1, high[2], 0)[2]
low_prev1   = ta.valuewhen(fractal_bot1, histogram[2], 0)[2]
low_price1  = ta.valuewhen(fractal_bot1, low[2], 0)[2]

//Divergenc : cdma histogram against candle value
regular_bearish_div1 = high[2] > high_price1 + divStren and histogram[2] < high_prev1 / divStren and ta.barssince(fractal_top1[1]) > divLength
regular_bullish_div1 = low[2]  < low_price1 - divStren  and histogram[2] > low_prev1 / divStren  and ta.barssince(fractal_bot1[1]) > divLength

//-------------------------cdma Divergenc range------------------------------------------------
//histogramColor
col1 = regular_bearish_div1 ? color.red : na
col2 = regular_bullish_div1 ? #00FF00EB : na
//plot
plot(title='看跌背离', series= fractal_top1 ? histogram[2] : na, color=col1, linewidth=3, offset=DivOffset)
plot(title='看涨背离', series= fractal_bot1 ? histogram[2] : na, color=col2, linewidth=3, offset=DivOffset)

// calculate ATR				--------------------------------------------------------------------------------------------------------------------------------------------------
atr = ta.ema(ta.tr(true), atrLength) * m
up = atr + high
dw = low - atr

//stratety : enrty and exit---------------------------------------------------------------------------------------------------------------------------------------------------------------------------------
if regular_bearish_div1 and fractal_top1
//if regular_bullish_div1 and fractal_bot1
    //label.new(bar_index, histogram[2], text = "Short", textcolor = color.white, color = color.gray,  style = label.style_label_lower_left)
    strategy.entry("Short", strategy.short, qty = 1)
    strategy.exit("exitShort", "Short", stop = up, limit = dw - atr)
if regular_bullish_div1 and fractal_bot1
//if regular_bearish_div1 and fractal_top1
    //label.new(bar_index, histogram[2], text = "Long", textcolor = color.white, color = color.fuchsia, style = label.style_label_upper_left)
	strategy.entry("Long", strategy.long, qty = 1)
    strategy.exit("exitLong", "Long", stop = dw, limit = up + atr)