概述
该策略结合了简单移动平均线(SMA)和滚动线性回归趋势线,设定买入条件是收盘价高于SMA和趋势线时做多, Exit条件是收盘价低于SMA和趋势线时平仓。该策略主要利用了SMA的均线交易信号以及滚动趋势线的支持,在突破上行通道时入场,突破下行通道时出场。
策略原理
该策略主要基于以下几个组件:
SMA: 简单移动平均线,以一定周期(smaPeriod)计算收盘价的平均值作为信号线。
滚动趋势线: 基于线性回归计算一定周期内(window)的最佳拟合直线作为趋势信号。计算方法是最小二乘法。
入场条件: 当收盘价高于SMA均线和滚动趋势线时,做多入场。
出场条件: 当收盘价低于SMA均线和滚动趋势线时,平仓出场。
这样,该策略主要依赖均线交易信号突破入场,以及通道突破出场。利用了移动平均线的均值回归特性以及线性回归通道的均值支持,实现了趋势跟踪突破操作。
策略优势分析
该策略集成了均线和趋势线双重过滤,可以有效减少假突破操作。同时,滚动趋势线提供了更准确的通道支撑,使交易决策更加可靠。主要优势如下:
- 双重过滤机制,避免假突破,提高决策准确性。
- 滚动趋势线提供动态通道,支持更精确的通道交易。
- 简单直观的交易逻辑,容易理解和实现。
- 可自定义参数,适应不同市场环境。
风险分析
该策略也存在一些风险,主要集中在以下几点:
- SMA和趋势线参数设置不当,可能导致错失交易机会或假突破过多。
- 大幅震荡市场中,SMA和趋势线QIAN提供的通道支持会减弱。
- 突破失败可能造成亏损,需要严格止损。
针对这些风险,可以从以下几点着手优化:
- 优化参数,不同品种可以设置不同参数组合。
- 加大止损幅度,降低单笔损失。
- 在震荡行情中暂停交易,避免被套。
策略优化方向
该策略可以从以下几个维度进行优化:
增加动态调整SMA周期和滑点参数的功能。在不同市场环境中自动优化参数。
增加弹性止损机制。当价格突破趋势线一定比例时止损。
结合其它指标过滤信号。例如量能指标,强弱指标等。提高决策准确性。
开发反转版本。在价格接近底部,并突破下行通道时做多。
总结
该策略整合了移动平均线交易信号和滚动趋势线通道支持,实现了趋势跟踪操作。双重过滤机制降低了假突破概率,提高了决策质量。简单参数设定,逻辑清晰,易于实施和优化调整。整体而言,该策略形成了一套可靠、简单、直观的趋势突破交易体系。
策略源码
/*backtest
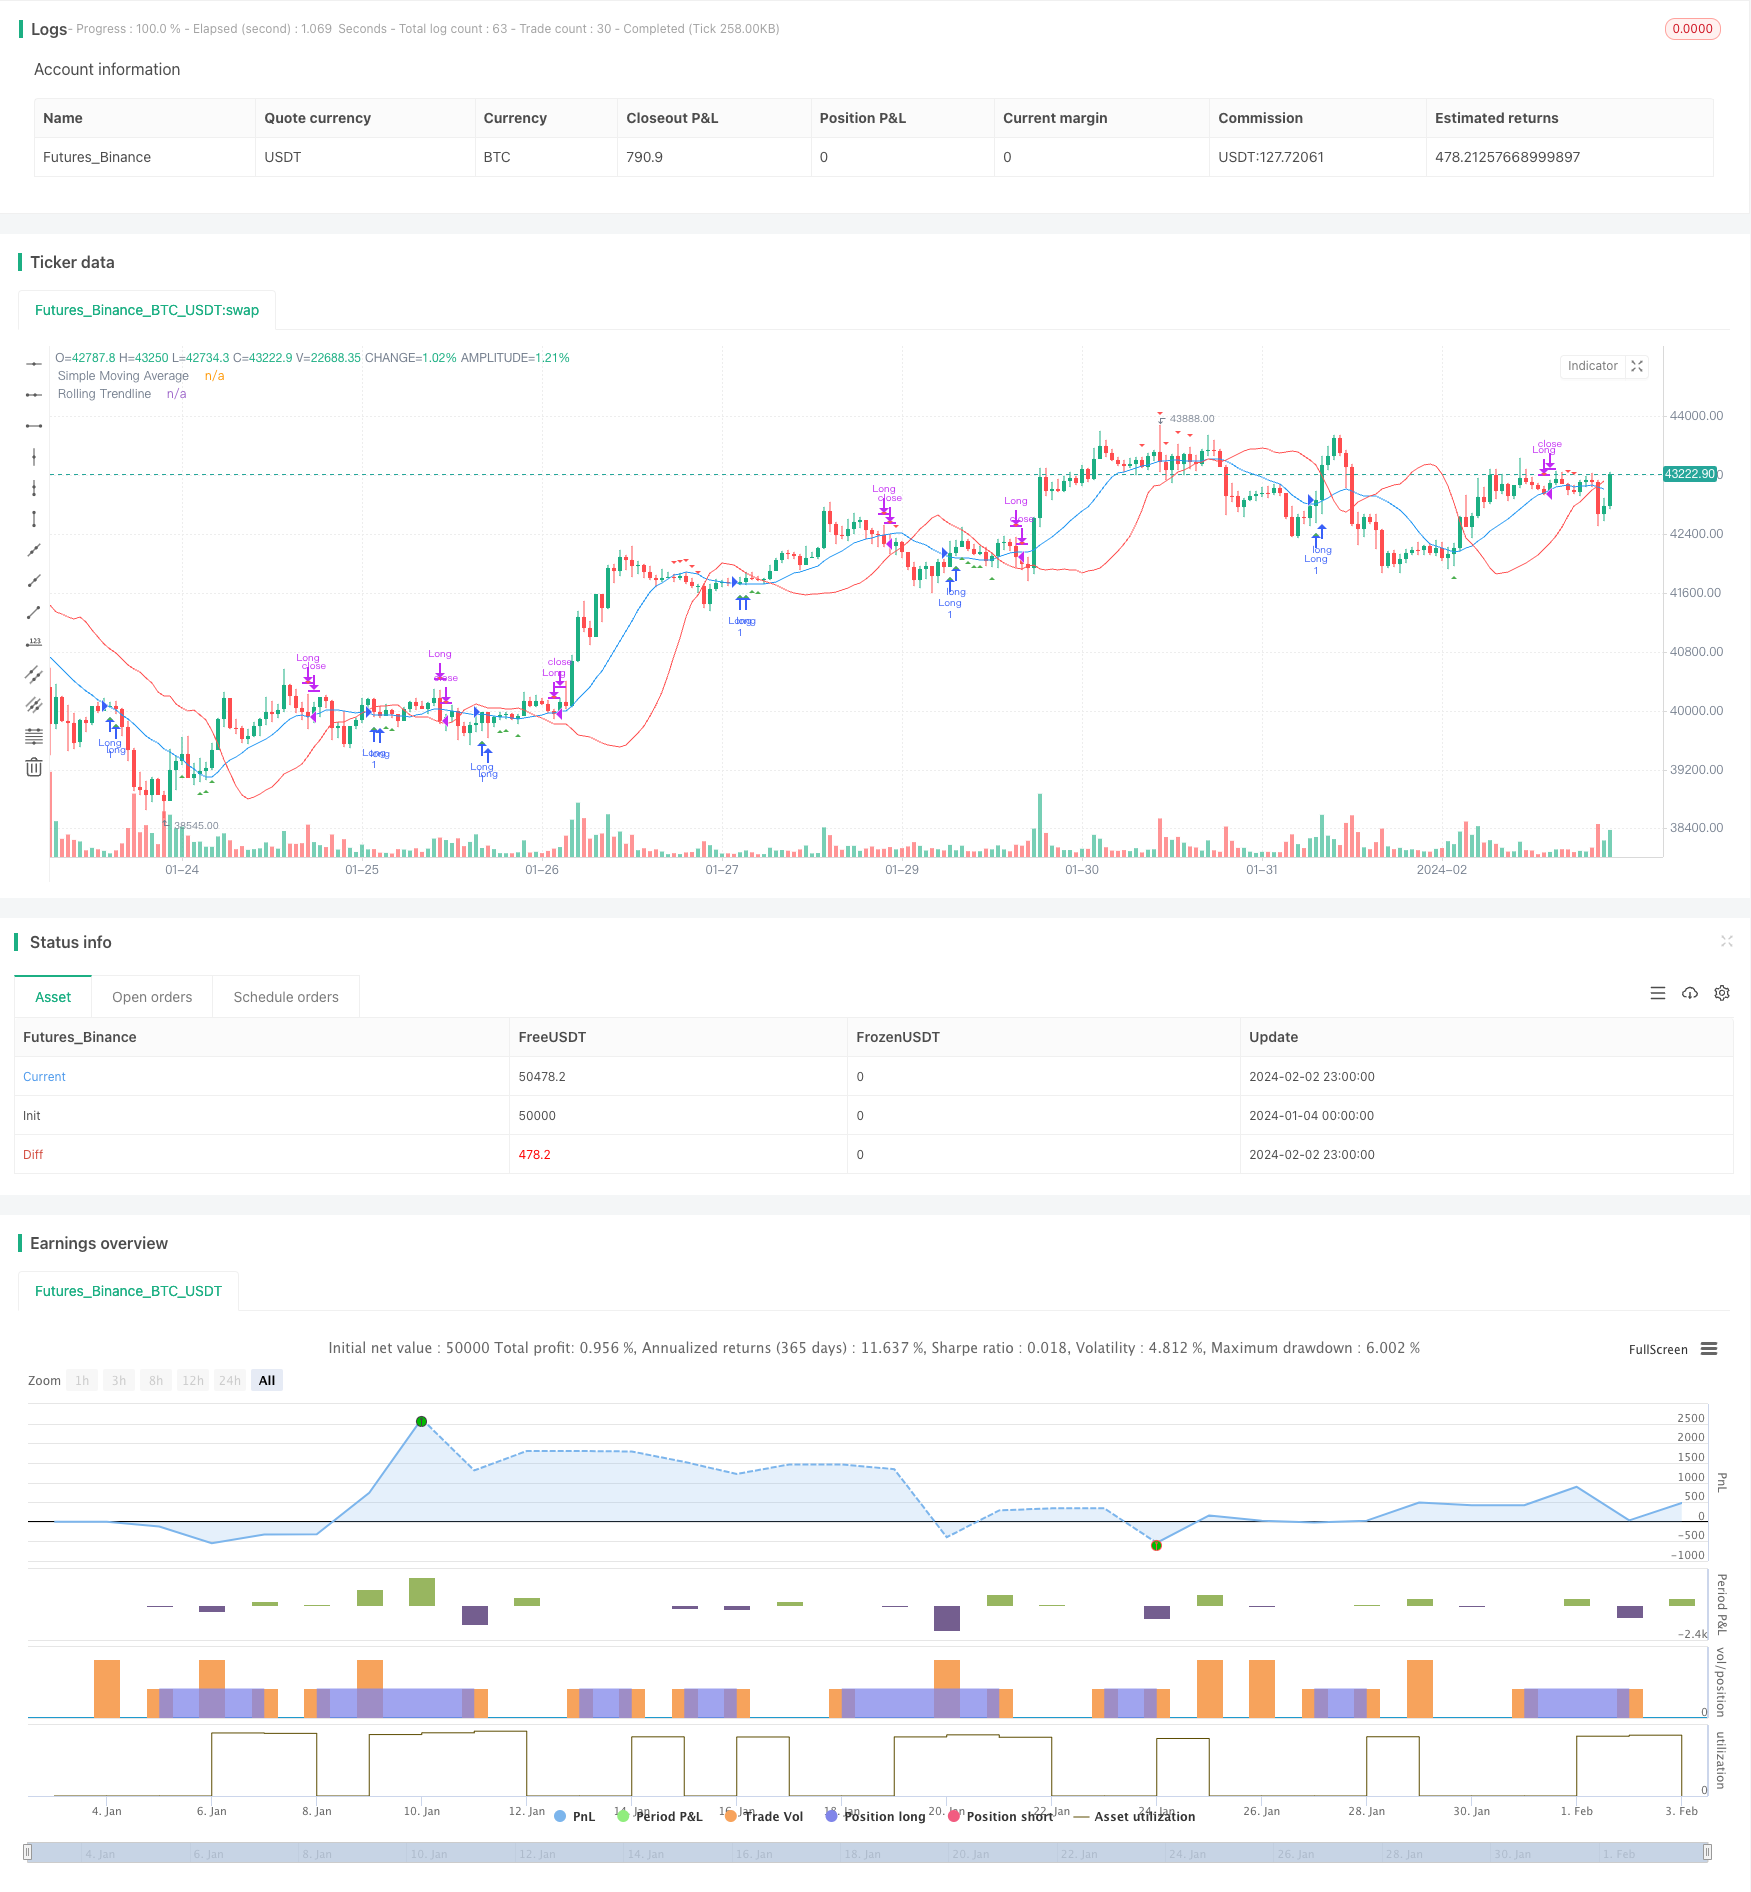
start: 2024-01-04 00:00:00
end: 2024-02-03 00:00:00
period: 1h
basePeriod: 15m
exchanges: [{"eid":"Futures_Binance","currency":"BTC_USDT"}]
*/
//@version=4
strategy("SMA Strategy with Rolling Trendline", overlay=true)
// Input parameters
smaPeriod = input(14, title="SMA Period")
window = input(20, title="Trendline Window")
startDate = input(timestamp("2023-01-01"), title="Start Date")
endDate = input(timestamp("2023-12-31"), title="End Date")
// Calculating SMA
sma = sma(close, smaPeriod)
// Function to calculate linear regression trendline for a window
linreg_trendline(window) =>
sumX = 0.0
sumY = 0.0
sumXY = 0.0
sumX2 = 0.0
for i = 0 to window - 1
sumX := sumX + i
sumY := sumY + close[i]
sumXY := sumXY + i * close[i]
sumX2 := sumX2 + i * i
slope = (window * sumXY - sumX * sumY) / (window * sumX2 - sumX * sumX)
intercept = (sumY - slope * sumX) / window
slope * (window - 1) + intercept
// Calculating the trendline
trendline = linreg_trendline(window)
// Entry and Exit Conditions
longCondition = close > sma and close < trendline
exitLongCondition = close < sma and close > trendline
// Strategy logic
if (true)
if (longCondition)
strategy.entry("Long", strategy.long)
if (exitLongCondition)
strategy.close("Long")
// Plotting
plot(sma, title="Simple Moving Average", color=color.blue)
plot(trendline, title="Rolling Trendline", color=color.red)
plotshape(series=longCondition, title="Enter Trade", location=location.belowbar, color=color.green, style=shape.triangleup)
plotshape(series=exitLongCondition, title="Exit Trade", location=location.abovebar, color=color.red, style=shape.triangledown)