概述
本文将深入分析一种基于RSI和布林带这两个技术指标的量化交易策略。该策略充分利用RSI识别超买超卖现象和布林带判断价格离散程度的优势,实现更准确判断市场走势的转折点。
策略原理
- RSI原理
RSI即相对强弱指数,是通过计算一段时间内股票价格变动的幅度大小,来计量这段时间内股票强弱程度的技术指标。它的取值范围在0-100之间,当RSI大于70时为超买区,小于30时为超卖区。出现超买超卖现象往往意味着价格可能反转。
- 布林带原理
布林带由中轨、上轨和下轨组成。中轨是n天的移动平均线,上轨是中轨+k倍的n天标准差,下轨是中轨-k倍的n天标准差。当价位接近上轨或下轨时,是中轴附近区域波动加大的信号,预示着可能的回转。
- 策略构建
该策略结合RSI指标判断超买超卖的时机以及布林带判断价格波动的时机,在RSI指标进入超买区或超卖区的同时,价格接触布林带上轨或下轨产生交易信号,以捕捉价格趋势的转折点。从而实 现低买高卖的效果。
优势分析
充分利用RSI指标判断超买超卖的优势,设置合理的超买超卖阈值,避免虚假信号。
借助布林带判断价格波动和离散情况,结合RSI形成交易决策依据,提高决策的准确性。
RSI和布林带互相验证判断,双重指标过滤减少错误交易的可能性。
能够有效识别价格上涨和下跌的转折点,捕捉价格反转机会。
风险分析
无法完全避免技术指标产生错误信号的可能。
RSI参数和布林带参数设置不当,可能错失交易机会或增加不必要交易。
行情剧烈波动时,仍有可能出现止损的风险。
需要适当调整参数以适应不同品种和市场环境。
优化方向
对RSI指标和布林带参数进行测试和优化,找到最优参数。
增加止损策略,严格控制单笔损失。
结合其他指标进行验证,如KDJ、MACD等以提高稳健性。
增加自动参数调整模块,使策略参数动态适应当前市场环境。
总结
基于RSI和布林带的量化交易策略,通过双重技术指标验证和组合,能有效判断价格趋势转折点。策略简单实用易于实现,具有准确性高、频繁交易、容易优化等优点。但仍需要注意风险控制,并进行参数测试、止损策略和指标优化等工作,以提高策略稳定性和盈利能力。
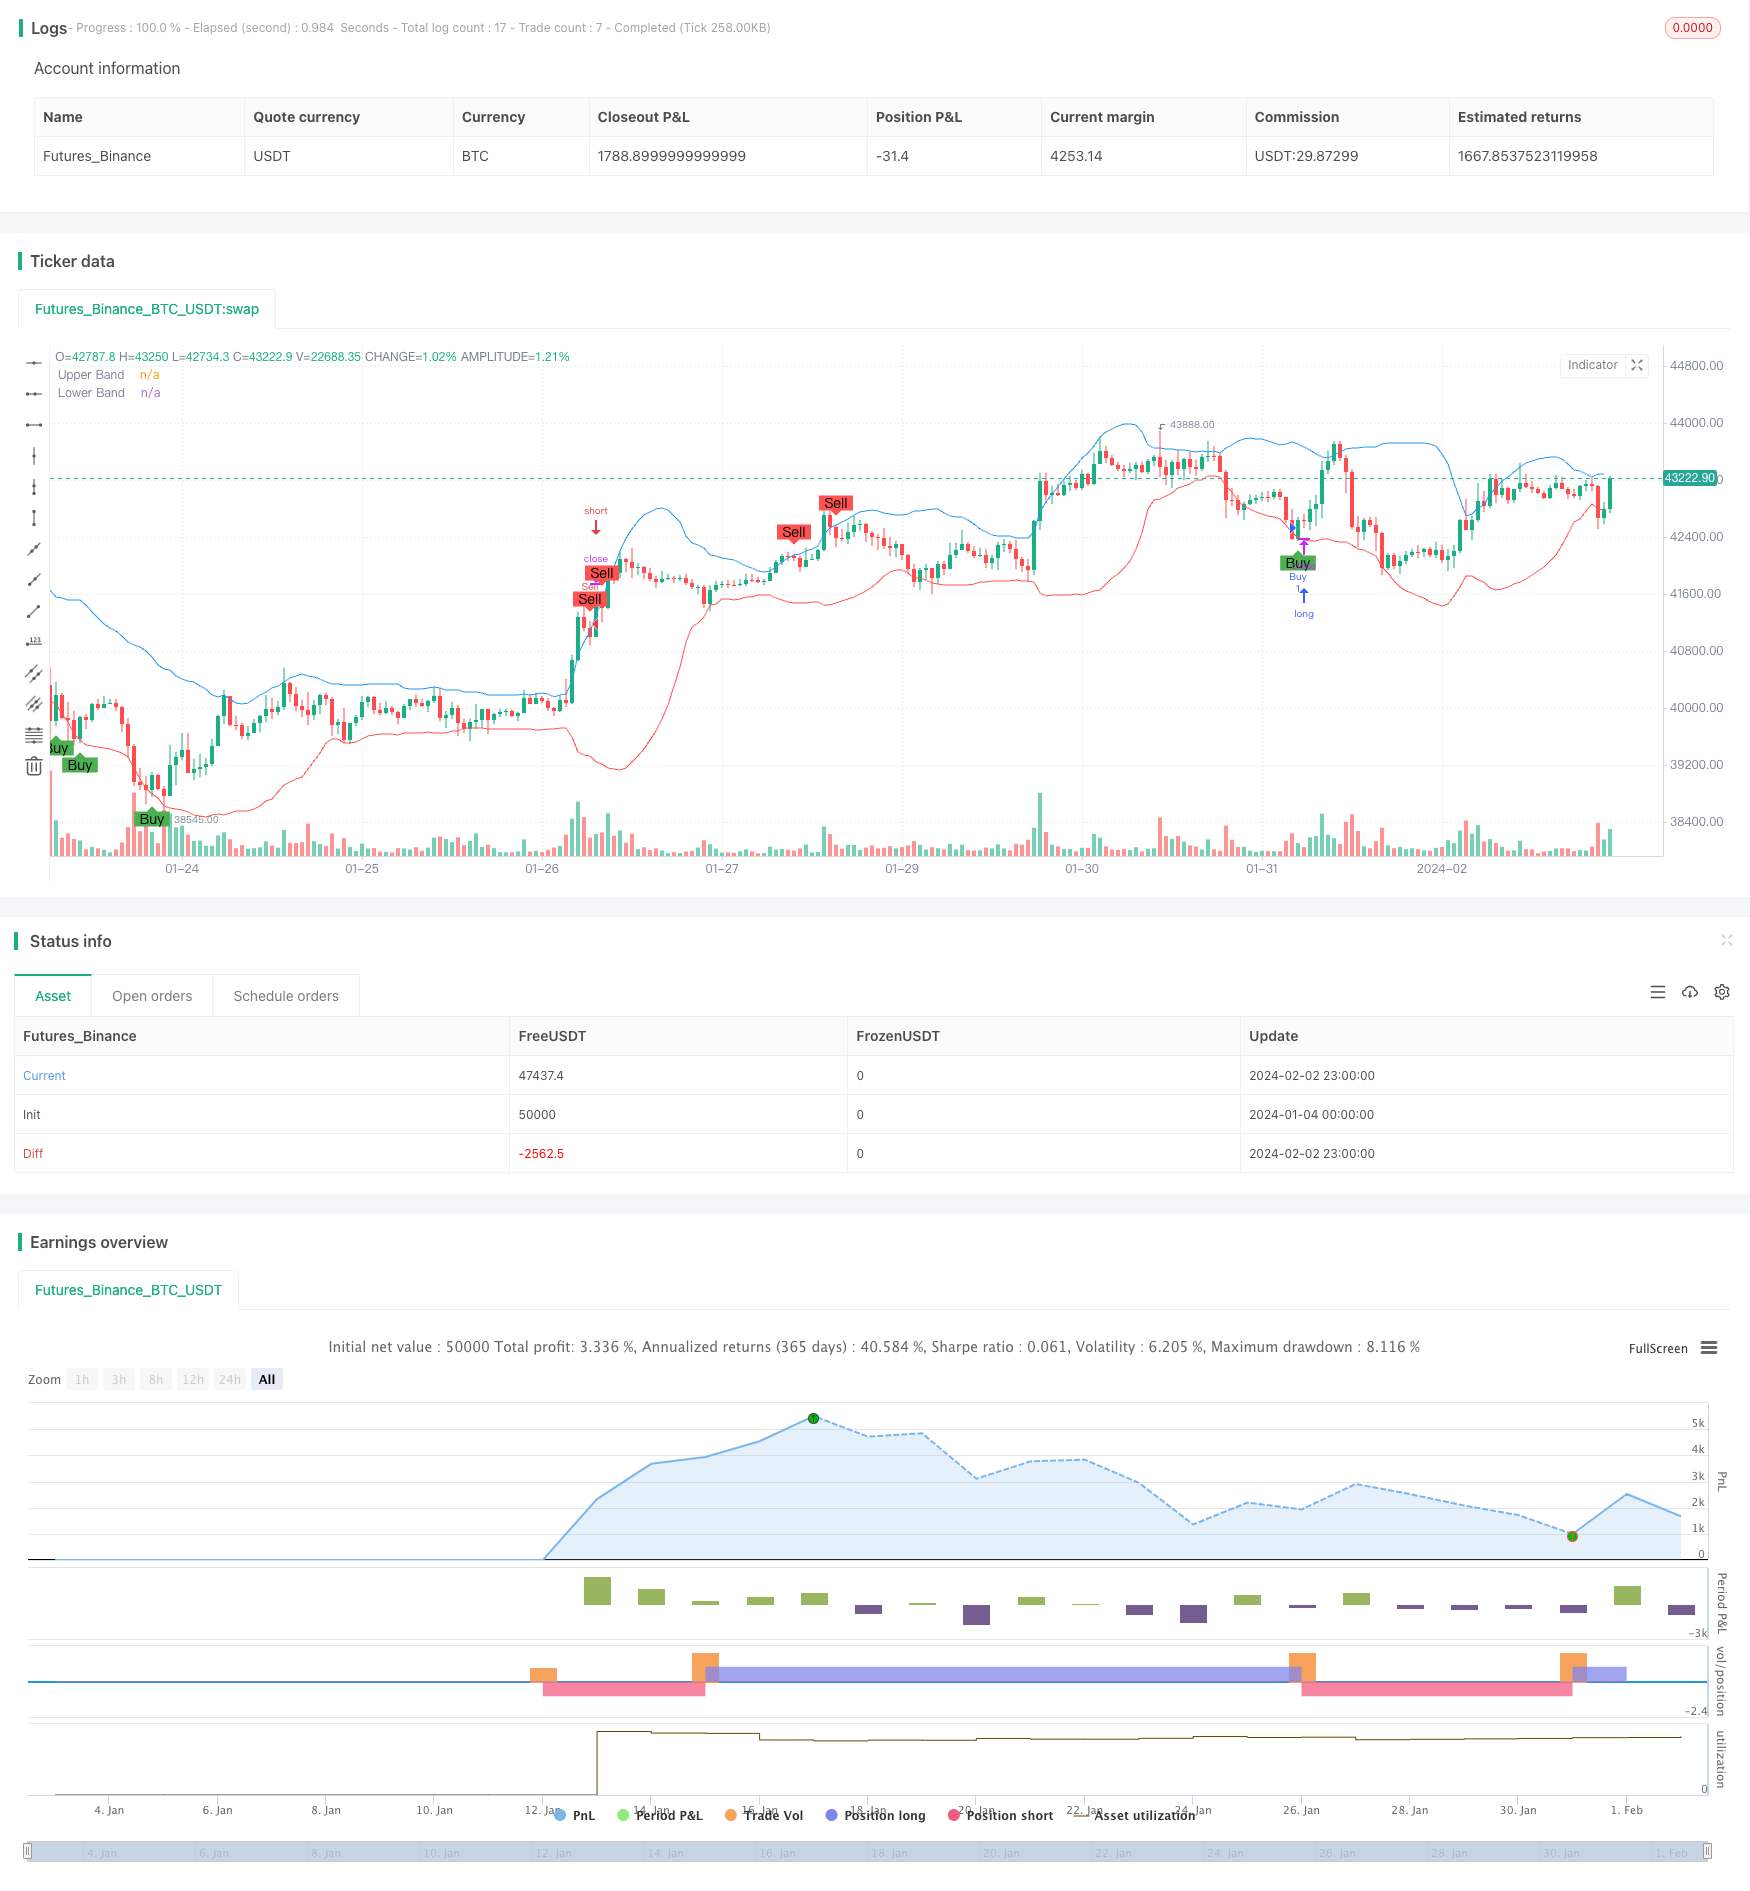
/*backtest
start: 2024-01-04 00:00:00
end: 2024-02-03 00:00:00
period: 1h
basePeriod: 15m
exchanges: [{"eid":"Futures_Binance","currency":"BTC_USDT"}]
*/

//@version=5
strategy("RSI & Bollinger Bands Strategy", overlay=true)

// RSI ayarları
rsi_length = input.int(14, title="RSI Length")
overbought = input.int(70, title="Overbought Level")
oversold = input.int(30, title="Oversold Level")
rsi = ta.rsi(close, rsi_length)

// Bollinger Bands ayarları
length = input.int(20, title="BB Length")
mult = input.float(2.0, title="BB Deviation")
basis = ta.sma(close, length)
dev = mult * ta.stdev(close, length)
upper = basis + dev
lower = basis - dev

// Alım-satım sinyalleri
longCondition = ta.crossover(rsi, oversold) and ta.crossover(close, lower)
shortCondition = ta.crossunder(rsi, overbought) and ta.crossunder(close, upper)

// Alım ve satım koşullarına göre işlem yapma
if (longCondition)
    strategy.entry("Buy", strategy.long)
if (shortCondition)
    strategy.entry("Sell", strategy.short)

// Alım ve satım sinyallerini görselleştirme
plotshape(series=longCondition, title="Buy Signal", location=location.belowbar, color=color.green, style=shape.labelup, text="Buy")
plotshape(series=shortCondition, title="Sell Signal", location=location.abovebar, color=color.red, style=shape.labeldown, text="Sell")

// Bollinger Bantları'nı grafik üzerine çizme
plot(upper, title="Upper Band", color=color.blue)
plot(lower, title="Lower Band", color=color.red)