概述
双移动均线趋势跟踪策略(Dual Moving Average Trend Tracking Strategy)是一个利用快速移动平均线和慢速移动平均线组合判断趋势方向,并结合K线实体颜色作为入场信号的量化交易策略。该策略同时具有趋势跟踪和反转交易的特点。
策略原理
该策略使用长度为20的慢速移动平均线判断整体趋势方向,当价格上穿时判断为上涨趋势,当价格下穿时判断为下跌趋势。同时使用长度为5的快速移动平均线作为入场过滤器,只有当价格突破快速移动平均线时才发出交易信号。此外,该策略还检查最近N根K线的实体颜色,当实体颜色连续变红时结合上涨趋势发出做多信号,当实体颜色连续变绿时结合下跌趋势发出做空信号,以防止假突破。
该策略综合判断了三个维度的信息:整体趋势、短期均线和K线实体,从而提高了交易信号的可靠性。当三者方向一致时,才会发出交易信号,有效过滤了部分噪音。
策略优势
同时具有趋势跟踪和反转交易的特点,可以适应不同市场环境。
交易信号发出前进行多维度判断,有效过滤假信号,提高胜率。
参数优化空间大,可以通过调整移动平均线长度、K线实体颜色判断根数等参数进行优化。
策略逻辑清晰简洁,容易理解,适合新手学习。
策略风险
大幅震荡行情中,容易形成osing streak,带来较大回撤。可以适当调整移动平均线参数或加入止损来规避。
在横盘整理阶段,容易形成whipsaw,带来损失。可以适当调整K线实体颜色判断的根数或关闭反转交易。
需要充分回测确保参数设置合理,否则会大幅影响策略表现。
优化方向
尝试不同类型的移动平均线,如指数移动平均线、Kaufman自适应移动平均线等。
增加交易量控制,如固定交易量或根据账户权益调整。
增加止损机制。当价格重新跌破慢速移动平均线时,可以考虑止损退出。
可以测试不同品种,判断策略稳定性和适应性。
总结
双移动均线趋势跟踪策略结合趋势判断和反转交易,可以有效抓取中长线趋势之余,也可以在短线获取额外收益。通过参数优化和机制增强,可以进一步扩大获利空间。该策略逻辑简单清晰,非常适合新手学习研究。但任何策略都需要在不同品种和参数下进行充分验证,确保其稳定性和盈利能力。
/*backtest
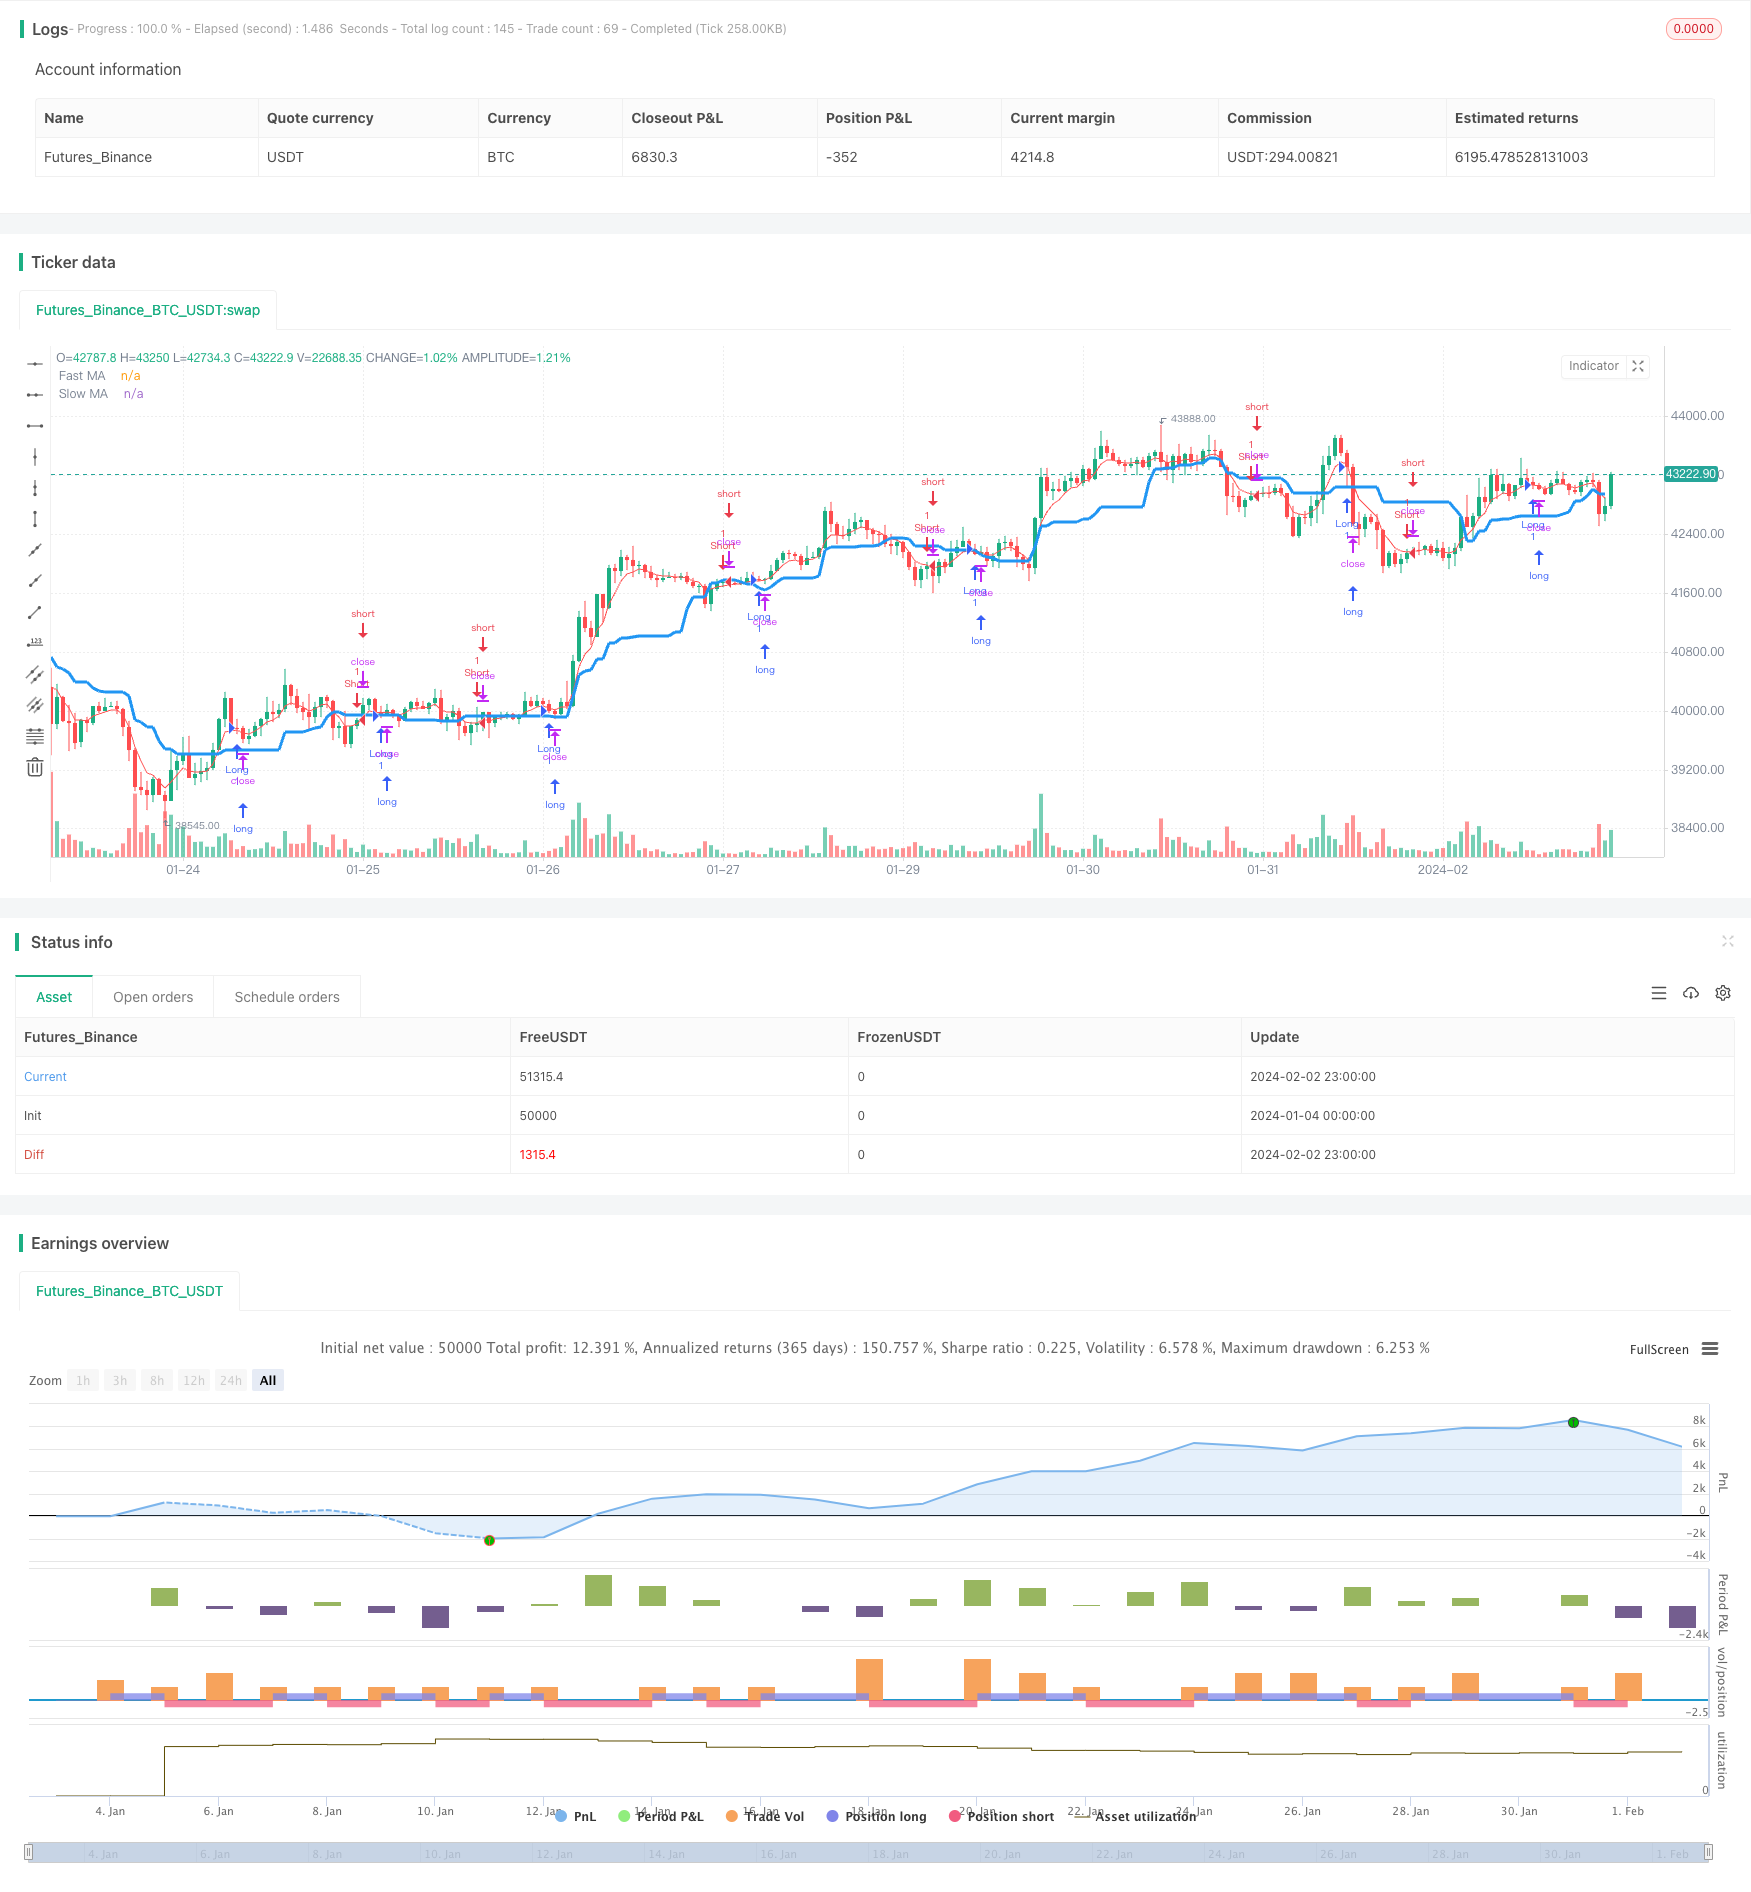
start: 2024-01-04 00:00:00
end: 2024-02-03 00:00:00
period: 1h
basePeriod: 15m
exchanges: [{"eid":"Futures_Binance","currency":"BTC_USDT"}]
*/
//@version=2
strategy(title = "Noro's Trend MAs 1.5", shorttitle = "Trend MAs 1.5", overlay=true, default_qty_type = strategy.percent_of_equity, default_qty_value=100.0, pyramiding=0)
//Settings
needlong = input(true, "long")
needshort = input(true, "short")
type = input(7, defval = 7, minval = 1, maxval = 7, title = "Type of Slow MA")
src = input(close, defval = close, title = "Source of Slow MA")
usefastsma = input(true, "Use fast MA Filter")
fastlen = input(5, defval = 5, minval = 1, maxval = 50, title = "fast MA Period")
len = input(20, defval = 20, minval = 2, maxval = 200, title = "slow MA Period")
bars = input(2, defval = 2, minval = 0, maxval = 3, title = "Bars Q")
fastsma = ema(src, fastlen)
//DEMA
dema = 2 * ema(src, len) - ema(ema(close, len), len)
//TEMA
xPrice = close
xEMA1 = ema(src, len)
xEMA2 = ema(xEMA1, len)
xEMA3 = ema(xEMA2, len)
tema = 3 * xEMA1 - 3 * xEMA2 + xEMA3
//KAMA
xvnoise = abs(src - src[1])
nfastend = 0.20
nslowend = 0.05
nsignal = abs(src - src[len])
nnoise = sum(xvnoise, len)
nefratio = iff(nnoise != 0, nsignal / nnoise, 0)
nsmooth = pow(nefratio * (nfastend - nslowend) + nslowend, 2)
kama = nz(kama[1]) + nsmooth * (src - nz(kama[1]))
//PriceChannel
lasthigh = highest(src, len)
lastlow = lowest(src, len)
center = (lasthigh + lastlow) / 2
//Trend
ma = type == 1 ? sma(src, len) : type == 2 ? ema(src, len) : type == 3 ? vwma(src, len) : type == 4 ? dema : type == 5 ? tema : type == 6 ? kama : type == 7 ? center : 0
trend = low > ma ? 1 : high < ma ? -1 : trend[1]
//Bars
bar = close > open ? 1 : close < open ? -1 : 0
redbars = bars == 0 ? 1 : bars == 1 and bar == -1 ? 1 : bars == 2 and bar == -1 and bar[1] == -1 ? 1 : bars == 3 and bar == -1 and bar[1] == -1 and bar[2] == -1 ? 1 : 0
greenbars = bars == 0 ? 1 : bars == 1 and bar == 1 ? 1 : bars == 2 and bar == 1 and bar[1] == 1 ? 1 : bars == 3 and bar == 1 and bar[1] == 1 and bar[2] == 1 ? 1 : 0
//Signals
up = trend == 1 and (low < fastsma or usefastsma == false) and redbars == 1 ? 1 : 0
dn = trend == -1 and (high > fastsma or usefastsma == false) and greenbars == 1 ? 1 : 0
//Lines
colorfastsma = usefastsma == true ? red : na
plot(fastsma, color = colorfastsma, title = "Fast MA")
plot(ma, color = blue, linewidth = 3, transp = 0, title = "Slow MA")
//Trading
longCondition = up == 1
if (longCondition)
strategy.entry("Long", strategy.long, needlong == false ? 0 : na)
shortCondition = dn == 1
if (shortCondition)
strategy.entry("Short", strategy.short, needshort == false ? 0 : na)